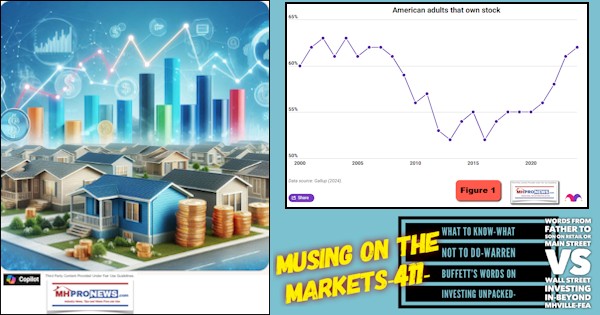
The Institute for Building Technology and Safety (IBTS) has collected data for the U.S. Department of Housing and Urban Development (HUD). IBTS data thus becomes “official” federal data.
What follows following the recap of the national totals reporting in October and are for the manufactured home “Shipments and Production Summary Report 08/01/2020 – 08/31/2020.” The totals of that state-based data were reported earlier this month in an MHProNews report an analysis.
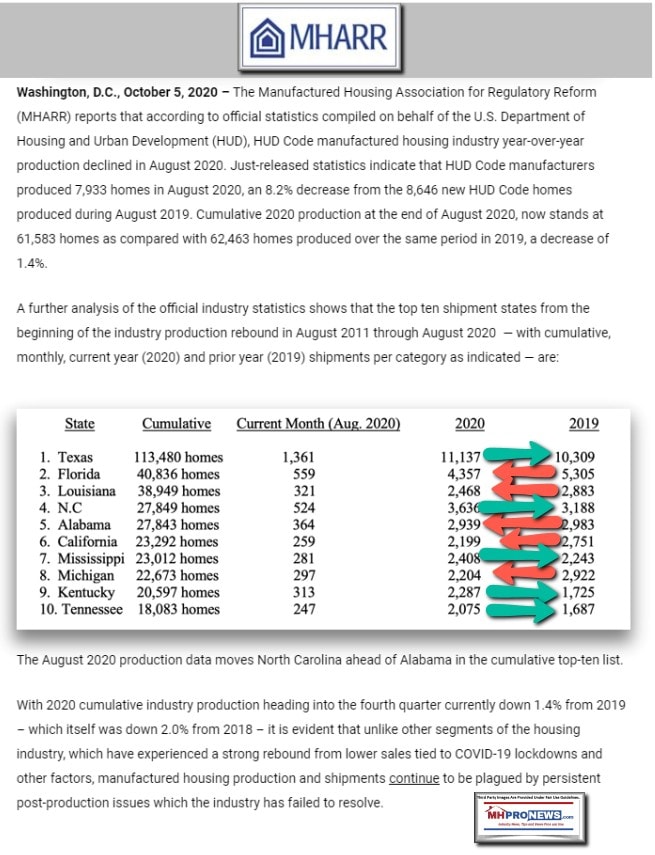
Additionally, MHARR provided in the report linked above an aggregate of the national data, plus the top states and compares the cumulative totals.
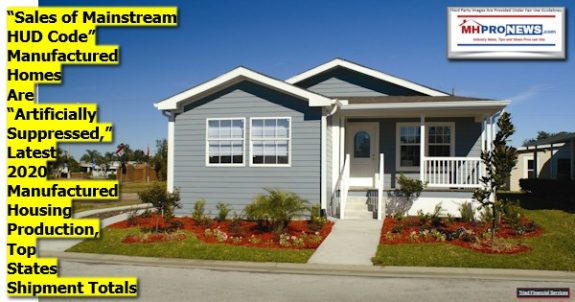
But what about the state-by-state data for the other 40 states? That is the data that follows below, with credit for the data to IBTS.
| Shipments | ||||
| State | Single Sections | Multi-Sections | Total | Floors |
| Dest. Pending | 4 | 4 | 8 | 12 |
| Alabama | 160 | 204 | 364 | 571 |
| Alaska | 10 | 0 | 10 | 10 |
| Arizona | 43 | 126 | 169 | 295 |
| Arkansas | 67 | 90 | 157 | 247 |
| California | 52 | 207 | 259 | 483 |
| Colorado | 94 | 26 | 120 | 146 |
| Connecticut | 4 | 4 | 8 | 12 |
| Delaware | 9 | 13 | 22 | 35 |
| District of Columbia | 0 | 0 | 0 | 0 |
| Florida | 194 | 365 | 559 | 927 |
| Georgia | 85 | 198 | 283 | 486 |
| Hawaii | 0 | 1 | 1 | 2 |
| Idaho | 1 | 30 | 31 | 68 |
| Illinois | 58 | 42 | 100 | 143 |
| Indiana | 112 | 37 | 149 | 186 |
| Iowa | 52 | 20 | 72 | 92 |
| Kansas | 38 | 19 | 57 | 76 |
| Kentucky | 113 | 200 | 313 | 514 |
| Louisiana | 180 | 141 | 321 | 468 |
| Maine | 34 | 36 | 70 | 106 |
| Maryland | 5 | 1 | 6 | 7 |
| Massachusetts | 4 | 10 | 14 | 24 |
| Michigan | 148 | 149 | 297 | 446 |
| Minnesota | 45 | 42 | 87 | 129 |
| Mississippi | 138 | 143 | 281 | 424 |
| Missouri | 60 | 57 | 117 | 174 |
| Montana | 12 | 15 | 27 | 42 |
| Nebraska | 17 | 10 | 27 | 37 |
| Nevada | 11 | 31 | 42 | 74 |
| New Hampshire | 17 | 24 | 41 | 65 |
| New Jersey | 34 | 12 | 46 | 58 |
| New Mexico | 50 | 46 | 96 | 144 |
| New York | 60 | 97 | 157 | 254 |
| North Carolina | 270 | 254 | 524 | 778 |
| North Dakota | 14 | 19 | 33 | 52 |
| Ohio | 144 | 61 | 205 | 266 |
| Oklahoma | 81 | 69 | 150 | 219 |
| Oregon | 11 | 87 | 98 | 193 |
| Pennsylvania | 102 | 71 | 173 | 244 |
| Rhode Island | 3 | 2 | 5 | 7 |
| South Carolina | 141 | 219 | 360 | 579 |
| South Dakota | 26 | 15 | 41 | 56 |
| Tennessee | 80 | 167 | 247 | 415 |
| Texas | 607 | 754 | 1,361 | 2,123 |
| Utah | 10 | 16 | 26 | 44 |
| Vermont | 8 | 9 | 17 | 26 |
| Virginia | 48 | 49 | 97 | 146 |
| Washington | 10 | 102 | 112 | 217 |
| West Virginia | 26 | 62 | 88 | 150 |
| Wisconsin | 54 | 27 | 81 | 108 |
| Wyoming | 1 | 3 | 4 | 7 |
| Canada | 0 | 0 | 0 | 0 |
| Puerto Rico | 0 | 0 | 0 | 0 |
| Total | 3,547 | 4,386 | 7,933 | 12,387 |
In the production data that follows, IBTS said that (*) “These States Have Fewer Than Three Plants… Totals To Protect Proprietary Information.”
| Production | ||||
| State | SW | MW | Total | Floors |
| States Shown(*) | 274 | 250 | 524 | 777 |
| Alabama | 536 | 709 | 1,245 | 1,965 |
| *Alaska | 0 | 0 | 0 | 0 |
| Arizona | 50 | 156 | 206 | 364 |
| *Arkansas | 0 | 0 | 0 | 0 |
| California | 54 | 180 | 234 | 423 |
| *Colorado | 0 | 0 | 0 | 0 |
| *Connecticut | 0 | 0 | 0 | 0 |
| *Delaware | 0 | 0 | 0 | 0 |
| *District of Columbia | 0 | 0 | 0 | 0 |
| Florida | 64 | 154 | 218 | 376 |
| Georgia | 195 | 368 | 563 | 935 |
| *Hawaii | 0 | 0 | 0 | 0 |
| Idaho | 15 | 81 | 96 | 187 |
| *Illinois | 0 | 0 | 0 | 0 |
| Indiana | 524 | 270 | 794 | 1,064 |
| *Iowa | 0 | 0 | 0 | 0 |
| *Kansas | 0 | 0 | 0 | 0 |
| *Kentucky | 0 | 0 | 0 | 0 |
| *Louisiana | 0 | 0 | 0 | 0 |
| *Maine | 0 | 0 | 0 | 0 |
| *Maryland | 0 | 0 | 0 | 0 |
| *Massachusetts | 0 | 0 | 0 | 0 |
| *Michigan | 0 | 0 | 0 | 0 |
| Minnesota | 33 | 62 | 95 | 157 |
| *Mississippi | 0 | 0 | 0 | 0 |
| *Missouri | 0 | 0 | 0 | 0 |
| *Montana | 0 | 0 | 0 | 0 |
| *Nebraska | 0 | 0 | 0 | 0 |
| *Nevada | 0 | 0 | 0 | 0 |
| *New Hampshire | 0 | 0 | 0 | 0 |
| *New Jersey | 0 | 0 | 0 | 0 |
| *New Mexico | 0 | 0 | 0 | 0 |
| *New York | 0 | 0 | 0 | 0 |
| North Carolina | 129 | 191 | 320 | 511 |
| *North Dakota | 0 | 0 | 0 | 0 |
| *Ohio | 0 | 0 | 0 | 0 |
| *Oklahoma | 0 | 0 | 0 | 0 |
| Oregon | 22 | 194 | 216 | 427 |
| Pennsylvania | 226 | 269 | 495 | 764 |
| *Rhode Island | 0 | 0 | 0 | 0 |
| *South Carolina | 0 | 0 | 0 | 0 |
| *South Dakota | 0 | 0 | 0 | 0 |
| Tennessee | 554 | 669 | 1,223 | 1,893 |
| Texas | 871 | 833 | 1,704 | 2,544 |
| *Utah | 0 | 0 | 0 | 0 |
| *Vermont | 0 | 0 | 0 | 0 |
| *Virginia | 0 | 0 | 0 | 0 |
| *Washington | 0 | 0 | 0 | 0 |
| *West Virginia | 0 | 0 | 0 | 0 |
| *Wisconsin | 0 | 0 | 0 | 0 |
| *Wyoming | 0 | 0 | 0 | 0 |
| *Canada | 0 | 0 | 0 | 0 |
| *Puerto Rico | 0 | 0 | 0 | 0 |
| Total | 3,547 | 4,386 | 7,933 | 12,387 |
Conventional Housing Soaring…Affordable Manufactured Housing Struggling,
But There Is More to Know…
American Enterprise Institute Housing Center Director Edward Pinto, J.D., has issued a warning that the strong rise of conventional housing pricing and costs are not sustainable. Their data points to a need for manufactured housing to step up and meet the industry’s long-stated potential.

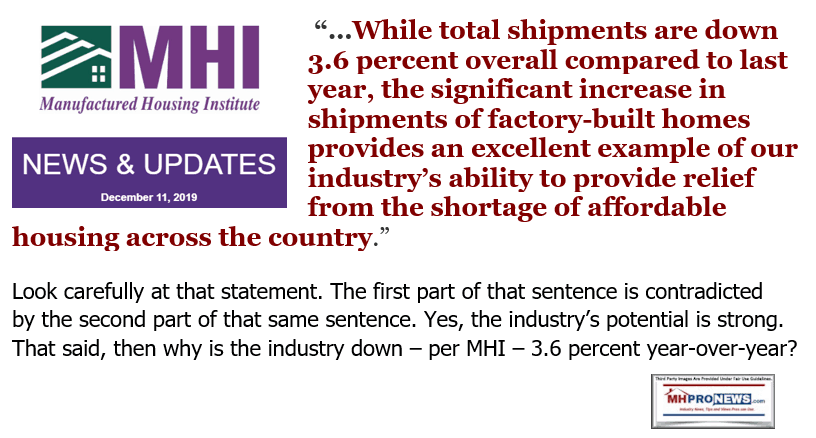
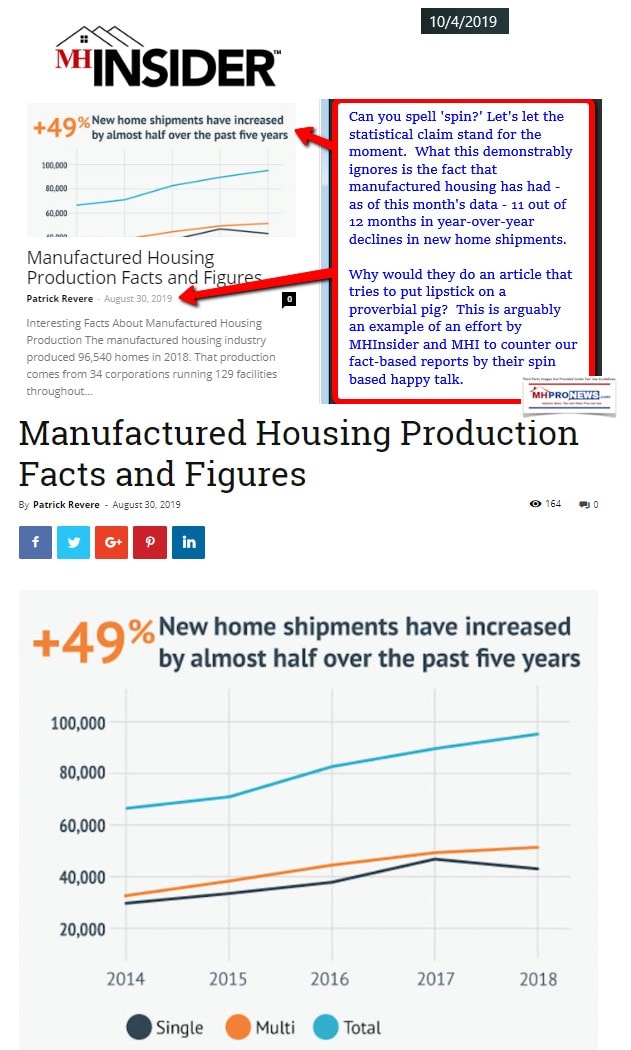
But there is no such surge, why? After years of the Manufactured Housing Institute (MHI) bragging about their various ‘promotions’ via advertorials, videos, social media, and so on…why is it that manufactured housing is lagging, even by their own admission?
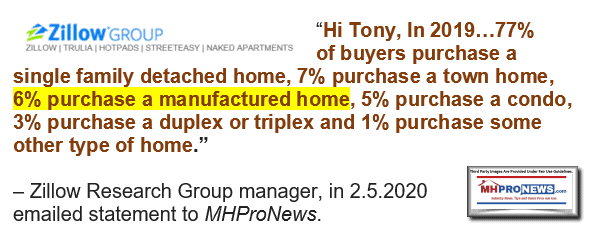

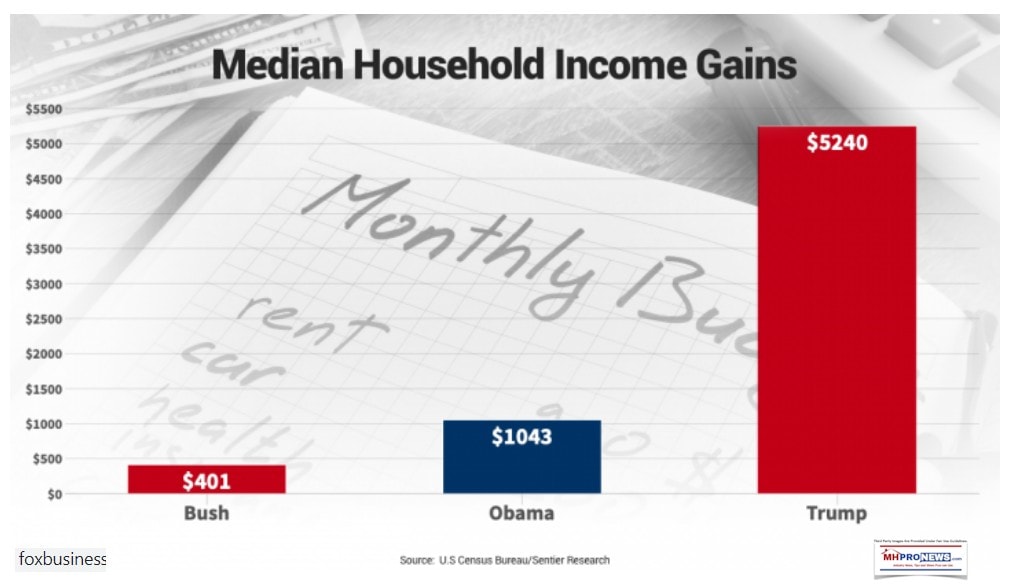
What some don’t know, or may not want to see, is that during the first years of the Trump Administration, the rate of minority home ownership rose over the rate from the eight year Obama-Biden era.
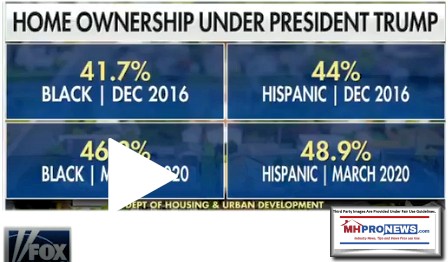
It is still too low, but during the first term of the Trump Administration, the rate of minority home ownership was moving in the right direction. Data from CNN Business and Fox Business reflect an improvement for minorities, women, and all Americans.
While conventional building confidence is soaring, why is manufactured housing snoring? The reasons are many.
See the reports above and those that follow to get a more complete sense of the answer to that question.


There is always more to read and more to come. Stay tuned with the runaway number one source for authentic “News through the lens of manufactured homes and factory-built housing” © where “We Provide, You Decide.” © ## (Affordable housing, manufactured homes, reports, fact-checks, analysis, and commentary. Third-party images or content are provided under fair use guidelines for media.) (See Related Reports, further below. Text/image boxes often are hot-linked to other reports that can be access by clicking on them.)

By L.A. “Tony” Kovach – for MHProNews.com.
Tony earned a journalism scholarship and earned numerous awards in history and in manufactured housing.
For example, he earned the prestigious Lottinville Award in history from the University of Oklahoma, where he studied history and business management. He’s a managing member and co-founder of LifeStyle Factory Homes, LLC, the parent company to MHProNews, and MHLivingNews.com.
This article reflects the LLC’s and/or the writer’s position, and may or may not reflect the views of sponsors or supporters.
Connect on LinkedIn: http://www.linkedin.com/in/latonykovach
Related References:
The text/image boxes below are linked to other reports, which can be accessed by clicking on them.
Hopeful News! Builder Confidence Grows, Views from Mainstream and Manufactured Housing
“More Punitive Regulatory” Regime Looms Warns New Manufactured Housing Industry Insider


