Per left-leaning Google’s Gemini on this date, NAHB has been producing some version of this “priced out” research since 1985.

Part I of this article will provide the NAHB Priced out research dated February 2025 (note the discrepancy or glitch by Gemini above that says March 2025). The NAHB special “priced out” study document is linked here as a download.
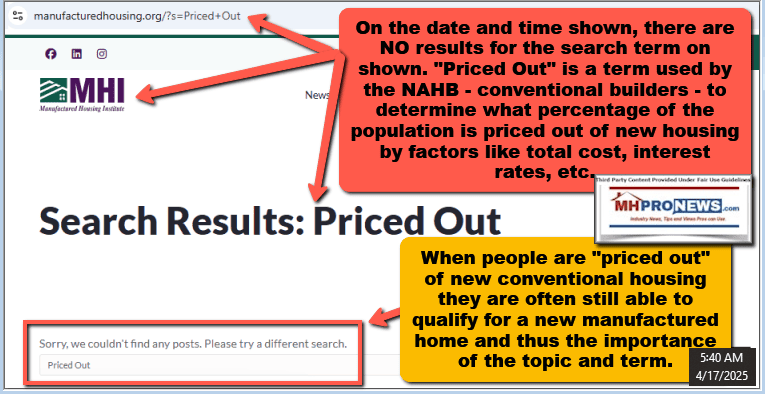
Part II provides an annotated screenshot of all a search of the Manufactured Housing Institute (MHI) website that reflects all of their posts pre-dawn on this date (4.17.2025) that used that potentially useful “priced out” terminology.
Part III provides an annotated/composite screenshot of the Manufactured Housing Association for Regulatory Reform (MHARR) website that indicates two pages of articles that include the use of that “priced out” term pre-dawn 4.17.2025.
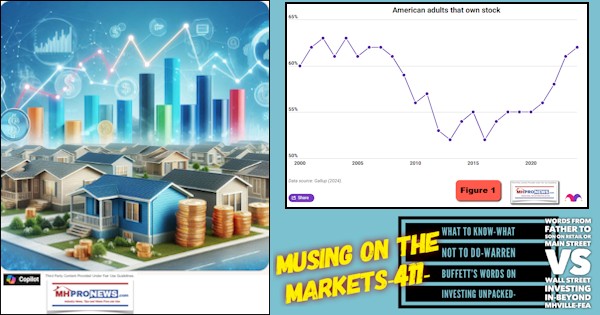
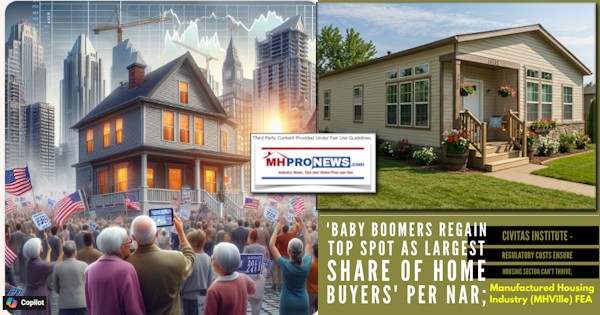
Part IV will provide additional information, including Google Gemini plus manufactured housing industry expert human analysis from MHProNews. The facts-evidence-analysis (FEA) follows. The reason why this subject matters to most Americans plus industry pros has aptly been stated by prominent MHI member Cavco Industries (CVCO). Cavco said that the lack of affordable housing (near where it is needed) is costly the U.S. economy about $2 trillion dollars a year, a data point that NEBR researchers, Senator Sheldon Whitehouse, the National Low Income Housing Coalition have each pointed to, among others citing similar or the same data.
Note that on the first two tables, the NAHB logo is added by MHProNews for clarity as to the source. The MHProNews third-party logo is added to each table and figure to reflect fair use in the context of this article. The tables and figures themselves are otherwise unchanged.
Part I.
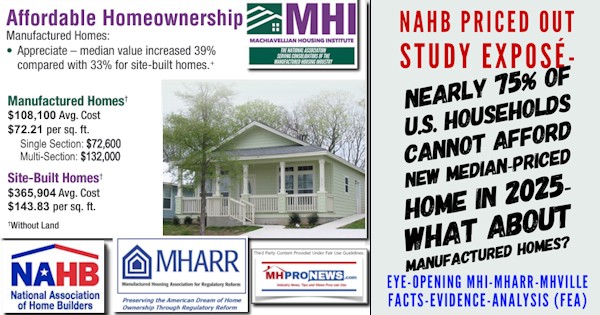
Nearly 75% of U.S. Households Cannot Afford a Median-Priced New Home in 2025
February 2025
Special Study for Housing Economics Na Zhao, Ph.D.
Economics and Housing Policy
National Association of Home Builders
Housing affordability remains a critical issue, with 74.9% of U.S. households unable to afford a median-priced new home in 2025, according to NAHB’s latest analysis. With a median price of $459,826 and a 30-year mortgage rate of 6.5%, this translates to around 100.6 million households priced out of the market, even before accounting for further increases in home prices or interest rates.
This analysis also highlights the effects of rising costs:
- A $1,000 increase in the median price of new homes would price an additional 115,593 households out of the market.
- A 25-basis point rise in the 30-year fixed mortgage rate (from 6.5% to 6.75%) would price approximately 1.1 million households out of the market.
In addition to the national numbers, the article includes equivalent affordability and priced-out results for individual states and more than 300 metropolitan areas.
The Priced-Out Methodology and Data
The NAHB priced-out model uses the ability to qualify for a mortgage to measure housing affordability. This method is generally relevant because most home buyers finance their new home purchase with conventional loans, following widely recognized underwriting standards. The standard NAHB adopts for its priced-out estimates is that the sum of the mortgage payment
(including the principal amount, loan interest, property tax, homeowners’ property and private mortgage insurance premiums (PITI), is no more than 28 percent of monthly gross household income.
As a result, the number of households that qualify for mortgages for a certain priced home depends on the household income distribution in an area and the mortgage interest rate at that time. The most recent detailed household income distributions for all states and metro areas are from the 2023 American Community Survey (ACS). NAHB adjusts the income distributions to reflect the income and population changes that may happen from 2023 to 2025. The income distribution is adjusted for inflation using the 2024 median family income at the state[1] and metro[2] levels and then extrapolated into 2025. The number of households in 2025 is projected by the growth rate of households from 2022 to 2023.
Other key assumptions in the NAHB’s calculation include a standard 10% down payment and a 30-year fixed rate mortgage at an interest rate of 6.5% with zero points. For a loan with this down payment, private mortgage insurance is required by lenders and thus included as part of PITI. The model assumes the annual private mortgage insurance premium is 73 basis points[3], based on the standard assumption of a national median credit score[4] of 738, a 10% down payment and a 30-year fixed mortgage rate. Effective local property tax rates and homeowner insurance rates are derived from the 2023 American Community Survey (ACS)[5], with the U.S.
average effective property tax rate being $9 per $1,000 of property value and average homeowner insurance at $3.57 per $1,000 of property value.
To calculate median new home prices across states and metropolitan areas, NAHB relies on data from the Census Bureau’s Building Permits Survey and the Survey of Construction. Initially, we determine the average value of new home permits for each state and metro area using data from the 2023 Building Permits Survey. It is important to note that permit values typically represent construction costs only and exclude the cost of raw land, brokerage commissions, marketing or financing costs. To convert from average permit values to median new home prices, NAHB employs scaling mark-ups ratios. These ratios are derived by comparing the median new home prices to the average permit values for each division, as estimated from the Survey of
Construction. Furthermore, to manage the extreme estimates in median new home prices, NAHB implements a quantile-based flooring and capping method. This method identifies outliers by comparing the estimated median new home prices to the median values of newly built homes from the American Community Survey. The outliers are then adjusted by setting a cap at the 90th percentile value and establishing a floor at the 10th percentile value, making sure that the estimates reflect a more accurate and realistic range of new home prices. Finally, the median new home prices are projected forward to 2025 using the latest NAHB home price forecasts.
U.S. Priced-Out Estimates
Under the assumption of a 6.5% mortgage rate, the minimum income required to purchase a new median-priced home value at $459,826 in 2025 is $141,366. At this income threshold, around 100.6 million U.S. households, or 74.9% of the total 141.1 million households, would be unable to afford this home, shown in Table 1. A $1,000 increase in the home price increases the minimum income needed to $141,674, pricing out an additional 115,593 households. This calculation shows that even slight increases in housing prices can have a significant impact, pushing more households beyond the threshold of affordability.

State and Metro Area Estimates
The 2025 priced-out estimates for all states and the District of Columbia are shown in Table 2. The table highlights the growing housing affordability challenges across the United States. In 23 states and the District of Columbia, over 80% of households are priced out of the median-priced new home market. This indicates a significant disconnect between rising home prices and household incomes.
Maine stands out as the state with the highest share of households (91.2%) unable to afford the state’s median new home price of $682,223. High-cost states such as Connecticut and Rhode Island follow closely, with 88.3% and 87.8% of households, respectively, struggling to afford new homes. Even in states with relatively lower median new home prices, affordability remains a major concern. For example, in Mississippi, where the median home price is $275,333, 70.2% of households still find these new homes out of reach. Meanwhile, Delaware, the state with better affordability in the analysis, has a median new home price of $373,666. However, around 58.2% of households in Delaware still struggle to afford a new home. Even modest price increases, such as an additional $1,000, could push thousands more households from affording these median priced new homes. For instance, in Texas, such an increase could price out over 11,000 households.
Table 3 shows the 2025 priced-out estimates for over 300 metropolitan statistical areas. The analysis estimates how many households in each metro area earn enough income to qualify for mortgages on median-priced new homes. In high-cost areas like the San Jose-Sunnyvale-Santa Clara, CA metro area, where new homes largely target high-income Silicon Valley residents, only 10% of all households meet the minimum income threshold of $437,963 required to qualify for a loan on a median priced new home. In contrast, in more affordable metro areas like Sierra Vista-Douglas, AZ, where the median new home price is $150,893, nearly two-thirds of households can afford a median priced new home. While higher home prices generally result in higher monthly mortgage payments and higher income thresholds, the relationship between home prices and affordability is not always linear. Factors like property taxes and insurance payments can also significantly impact monthly housing costs, adding complexity to affordability calculations.
The affordability of new homes and together with the population size of a metro area, significantly influence the priced-out impact of a $1,000 increase in new home prices. In metro areas where new homes are already unaffordable to most households, the effect of such an increase tends to be small. For instance, in the San Jose-Sunnyvale-Santa Clara, CA metro area, an additional $1,000 increase to the home price affects only 259 households, as only 10% of all households could afford such expensive new homes in the first place. Here, the additional price increase only affects a narrow share of high- income households at the upper end of the income distribution, where affordability is already stretched.
In contrast, metro areas, where new homes are more broadly affordable, experience a larger priced-out effect. A $1,000 increase in the median new home price affects a larger share of households in the “thicker part” of the income distribution. For example, in the Dallas-Fort Worth-Arlington, TX metro area, a $1,000 increase in new home price would disqualify 2,882 households from affording a median-priced new home. This is the largest priced-out effect among all metro areas, driven by the combination of relatively moderate home prices and a substantial population base.
Interest Rates
The NAHB 2025 priced-out estimates also highlight the significant impact of mortgage interest rates on the number of households able to afford median-priced new homes. As mortgage interest rates rise, monthly mortgage payments will rise as well, requiring higher household income thresholds to qualify for a loan. Table 4 shows the effect of each 25 basis-point increase in interest rates, from 3.75% to 8.25%, on affordability for a median-priced home at $459,826.
When interest rates increase from 6.5% to 6.75%, around 1.13 million households are priced out of the market, unable to meet the higher income threshold required to afford the increased monthly payments. Similarly, an increase from 7.75% to 8% would squeeze about 850,000 households out of the market. As high interest rates climb further, the priced-out effects diminish. This is because the increase affects a smaller share of households at the upper end of the income distribution, where fewer households can afford homes even before the rate hike.
In contrast, when interest rates are relatively low, a 25 basis-point increase has a much larger impact, as it affects a broader portion of households in the middle of the income distribution. For example, if the mortgage interest rate goes down from 5.25% to 5%, around 1.5 million more households will qualify the mortgage for the new homes at the median price of $459,826. This indicates lower interest rates can unlock homeownership opportunities for a substantial number of households.

Housing Affordability Pyramid
The housing affordability pyramid illustrates the number of households able to purchase a home at various price steps. Each step represents the number of households that can only afford homes within that specific price range. The largest share of households falls within the first step, where homes are priced under $200,000. As home prices increase, fewer and fewer households can afford the next price level, with the highest-priced homes—those over $2 million—having the smallest number of potential buyers. Housing affordability remains a critical challenge for households with income at the lower end of the spectrum.
The pyramid is based on income thresholds and underwriting standards. Under these assumptions, the minimum income required to purchase a $200,000 home at the mortgage rate of 6.5% is $61,487. In 2025, about 52.87 million households in the U.S. are estimated to have incomes no more than that threshold and, therefore, can only afford to buy homes priced up to $200,000. These 52.87 million households form the bottom step of the pyramid. Of the remaining households who can afford a home priced at $200,000, 23.53 million can only afford to pay a top price of somewhere between $200,000 and $300,000. These households make up the second step on the pyramid. Each subsequent step narrows further, reflecting the shrinking number of households that can afford increasingly expensive homes.

It is worthwhile to compare the number of households that can afford homes at various price levels and the number of owner-occupied homes available in those ranges, as shown in Figure 2. For example, while around 53 million households can afford home priced at $200,000 or less, there are only 22 million owner-occupied homes valued in this price range. This trend continues in the $200,000 – $300,000 price range, where the number of households that can afford homes is much higher than the number of housing units in that range. These imbalances show a shortage of affordable housing.

[1] The state median family income is published by Department of Housing and Urban Development (HUD).
[2] The MSA median family income is calculated by HUD and published by Federal Financial Institutions Examination Council (FFIEC).
[3] Private mortgage insurance premium (PMI) is obtained from the PMI Cost Calculator( https://www.hsh.com/calc-pmionly.html)
[4] Median credit score information is shown in the article “Four ways today’s high home prices affect the larger economy” October 2018 Urban Institute https://www.urban.org/urban-wire/four-ways-todays-high-home-prices-affectlarger-economy
[5] Producing metro level estimates from the ACS PUMS involves aggregating Public Use Microdata Area (PUMA) level data according to the latest definitions of metropolitan areas. Due to complexity of these procedures and since metro level insurance rates tend to remain stable over time, NAHB revises these estimates only periodically.
—
Part II – Manufactured Housing Institute (MHI) on “Priced Out”
1) Terminology matters, and Manufactured Housing Institute (MHI) senior leaders do or should know that to be true. In legislation, for example, changing just one word in a piece of legislation can (examples) can completely change the impact of a law. For example, in legislation using the word: “can,” “may,” “shall,” or “must” may have a significantly different legal meaning. An example of that is unpacked in the Duty to Serve manufactured home lending topic. MHARR has argued, for example, that “Duty” is a term that indicates that something is “mandatory.”

2) That said, when it comes to the “Priced Out” terminology, NAHB’s use is significant. As NAHB detailed above, the percentage of the population that may be “priced out” (i.e.: may not be able to qualify i.e.: get “priced out”) for a mortgage) based on a change of price of just $1000 or just a 1/4 percent change in a mortgage rate. Each of the tables above ought to be on the MHI website. Why? Because MHI has said for years that they represent “all segments” of manufactured housing. That means production and post-production.
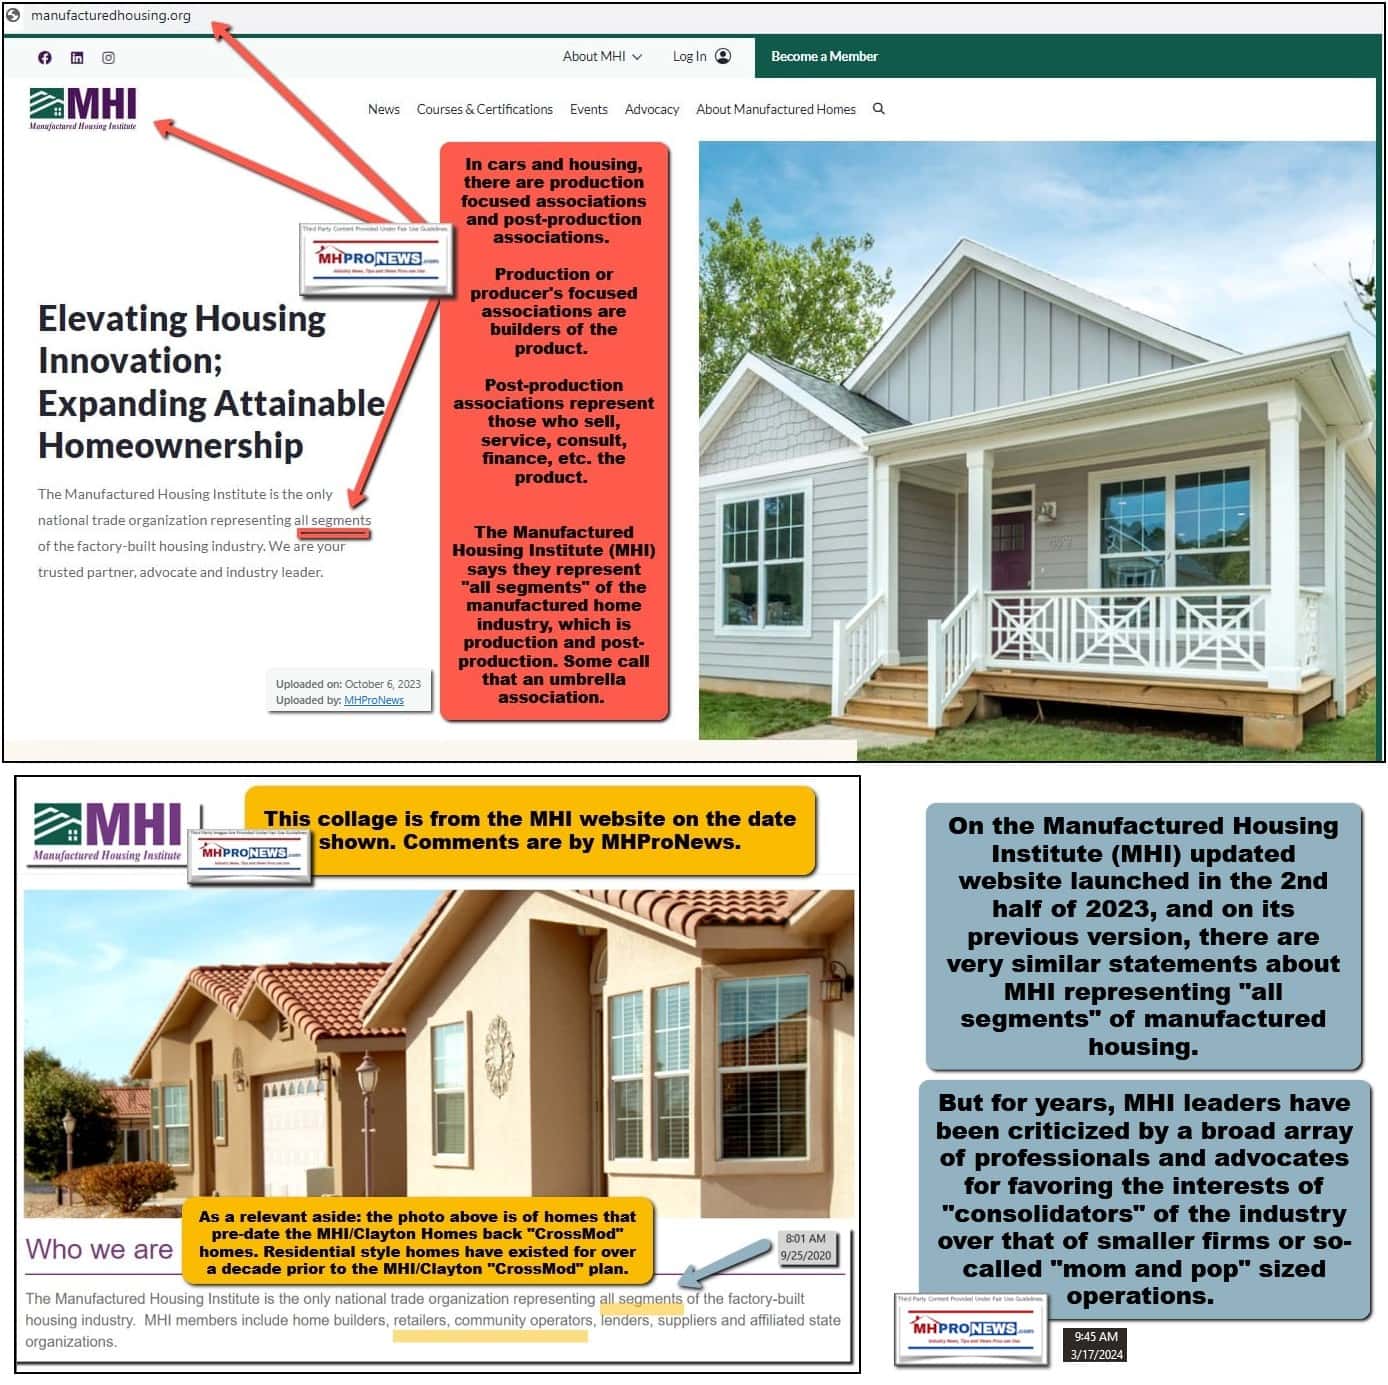
3) With those points noted, financing and zoning are “post-production” issues. Marketing and education are also “post-production” issues. One would therefor expect MHI to apply the NAHB terminology “priced out” themselves. But what does a search of their website reveal?
4) Pre-dawn 4.17.2025 there are no results on the MHI website for “priced out.” None. Nadda, zippo.
5) More on this in Part IV. But next up, what about MHARR? MHARR is focused on production issues.
Part III – MHARR and the use of “Priced Out” Terminology
1) MHARR emails and the MHARR website routinely use this terminology.
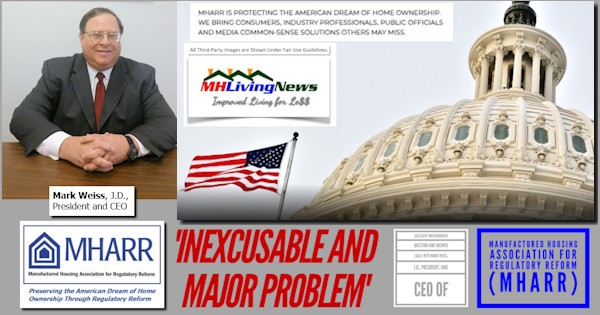
“The Manufactured Housing Association for Regulatory Reform is a Washington, D.C.- based national trade association representing the views and interests of independent producers of federally-regulated manufactured housing.”
So, MHARR is a production focused trade group. They do not have land lease communities, lenders, or even retailers as direct members (although some of their members may include some of those activities in their respective business models). The unifying point of MHARR advocacy is production-focused.
2) Nevertheless, for much of the 21st century, MHARR has drawn attention to apparent MHI failures in performing their own claimed areas of responsibility with respect to advocacy. So, while MHARR is still only a producers’ trade group, they draw attention to issues impacting producers that fall in the post-production arena. With that understanding, MHARR has been using the “priced out” terminology on their website for several years.
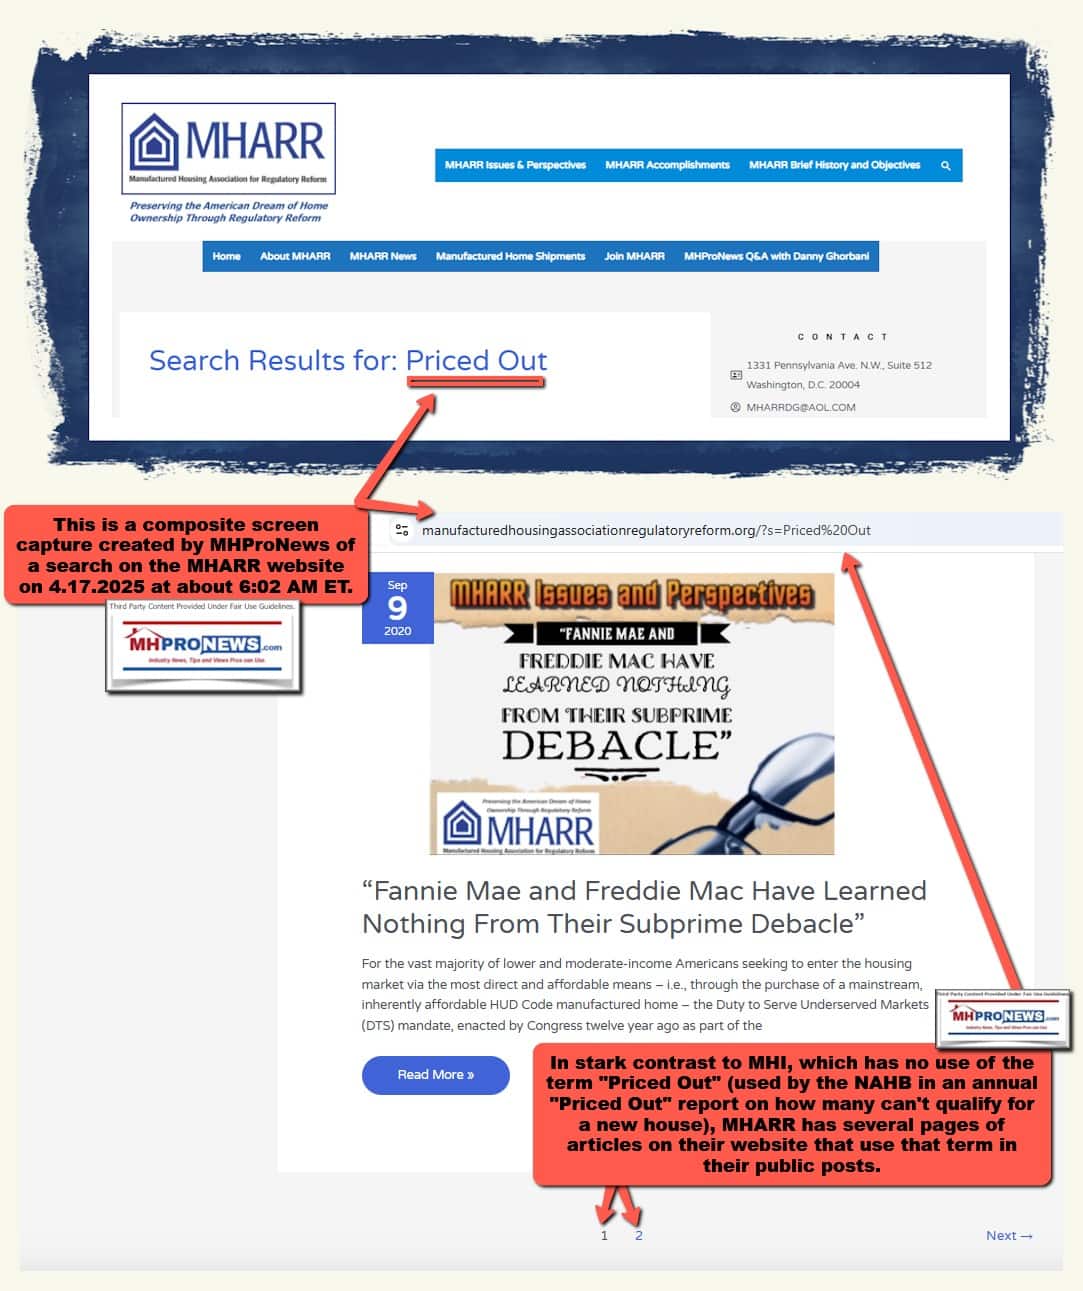
3) So, even as a production-focused trade group, MHARR has outperformed MHI in its use of the useful NAHB terminology of “priced out.”
Part IV Additional Information with More MHProNews Analysis and Commentary
1) According to the U.S. Census Bureau data the average costs of a new HUD Code manufactured home are as follows (see Part III for years of Census Bureau data on manufactured home costs by region and nationally).
| 2024 | Average | Single | Multi | ||||||||||||
| August | 127,800 | 86,600 | 156,300 | ||||||||||||
That same report (see Part II) said this.
Nearly Two-Thirds of U.S. Households are Family Households
Press Release Number: CB24-TPS-110NOV. 12, 2024 — Newly released estimates from the U.S. Census Bureau’s historical America’s Families and Living Arrangements tables show that about 64% of households were classified as family households in 2024. This marks a significant change from 50 years ago, when 79% of households were family households. Family households are defined as those that include at least one person related to the householder by birth, marriage or adoption.
In 2024, almost three-quarters (74%) of family households were married-couple households.
2) Clearly, a manufactured home has to be cited somewhere. So, the cost of the housing unit alone is only part of the picture. That was detailed in the report in March 2024 linked below.
From that report linked above are the following data points.
According to the U.S. Census Bureau in: “2022, show that before taxes, median household income declined 2.3% to $74,580…”
Per BankRate which cited data the National Association of Realtors (NAR), existing homes (not new construction) stood at “$387,600 as of November 2023.”
The Census Bureau said: “The median sales price of new houses sold in January 2024 was $420,700.”
Doing some basic math, 30 percent of $74,580 = $22,374.
Forbes reported that: “Nationwide Americans spend an average of $429.33 per month on utilities.”
Basic math tells us that $429.33 x 12 equals $5,151.96 annually.
22,374 – $5,151.96 = $17,222.04. That $17,222 and change is what the mortgage or rent payment should be for “affordable” housing. Good luck with that in March 2024. Here’s why. That is $1,435.16 monthly.
Rent Cafe said a 1-bedroom apartment is $1,470 and is an average of about 890 square feet, depending on the state. So, if you need two or three bedrooms, you have exceeded that 30 percent ratio for housing to be affordable.
3) Looking at the NAHB generated data (Part I of this article, above)
U.S. Priced-Out Estimates
Under the assumption of a 6.5% mortgage rate, the minimum income required to purchase a new median-priced home value at $459,826 in 2025 is $141,366. At this income threshold, around 100.6 million U.S. households, or 74.9% of the total 141.1 million households, would be unable to afford this home, shown in Table 1. A $1,000 increase in the home price increases the minimum income needed to $141,674, pricing out an additional 115,593 households.
Also, per NAHB in Part I above, regarding new housing.
For example, in Mississippi, where the median home price is $275,333, 70.2% of households still find these new homes out of reach. Meanwhile, Delaware, the state with better affordability in the analysis, has a median new home price of $373,666. However, around 58.2% of households in Delaware still struggle to afford a new home.
Meaning, while it may be better in some areas than others, nationally only about 25 percent of the U.S. population could qualify for a new single-family house based on that 6.5 percent interest rate.
4) Using the NAHB data in Part I above.
- 47.13 of U.S. households can afford a home $200,000 or more in value.
- As many as 52.87 percent of can afford a home 0-200K.
Meaning, the vast majority of U.S. households can afford a new HUD Code manufactured home.
This is one of several arguments that MHI should be shouting from the rooftops. While a similar data point can be found on the public side of the MHI website, it requires effort. There is an argument to be made that MHI has all but ‘buried’ the data which could or should be front and center on every page of their website.
That noted, MHI’s website has the following for those willing to dig.
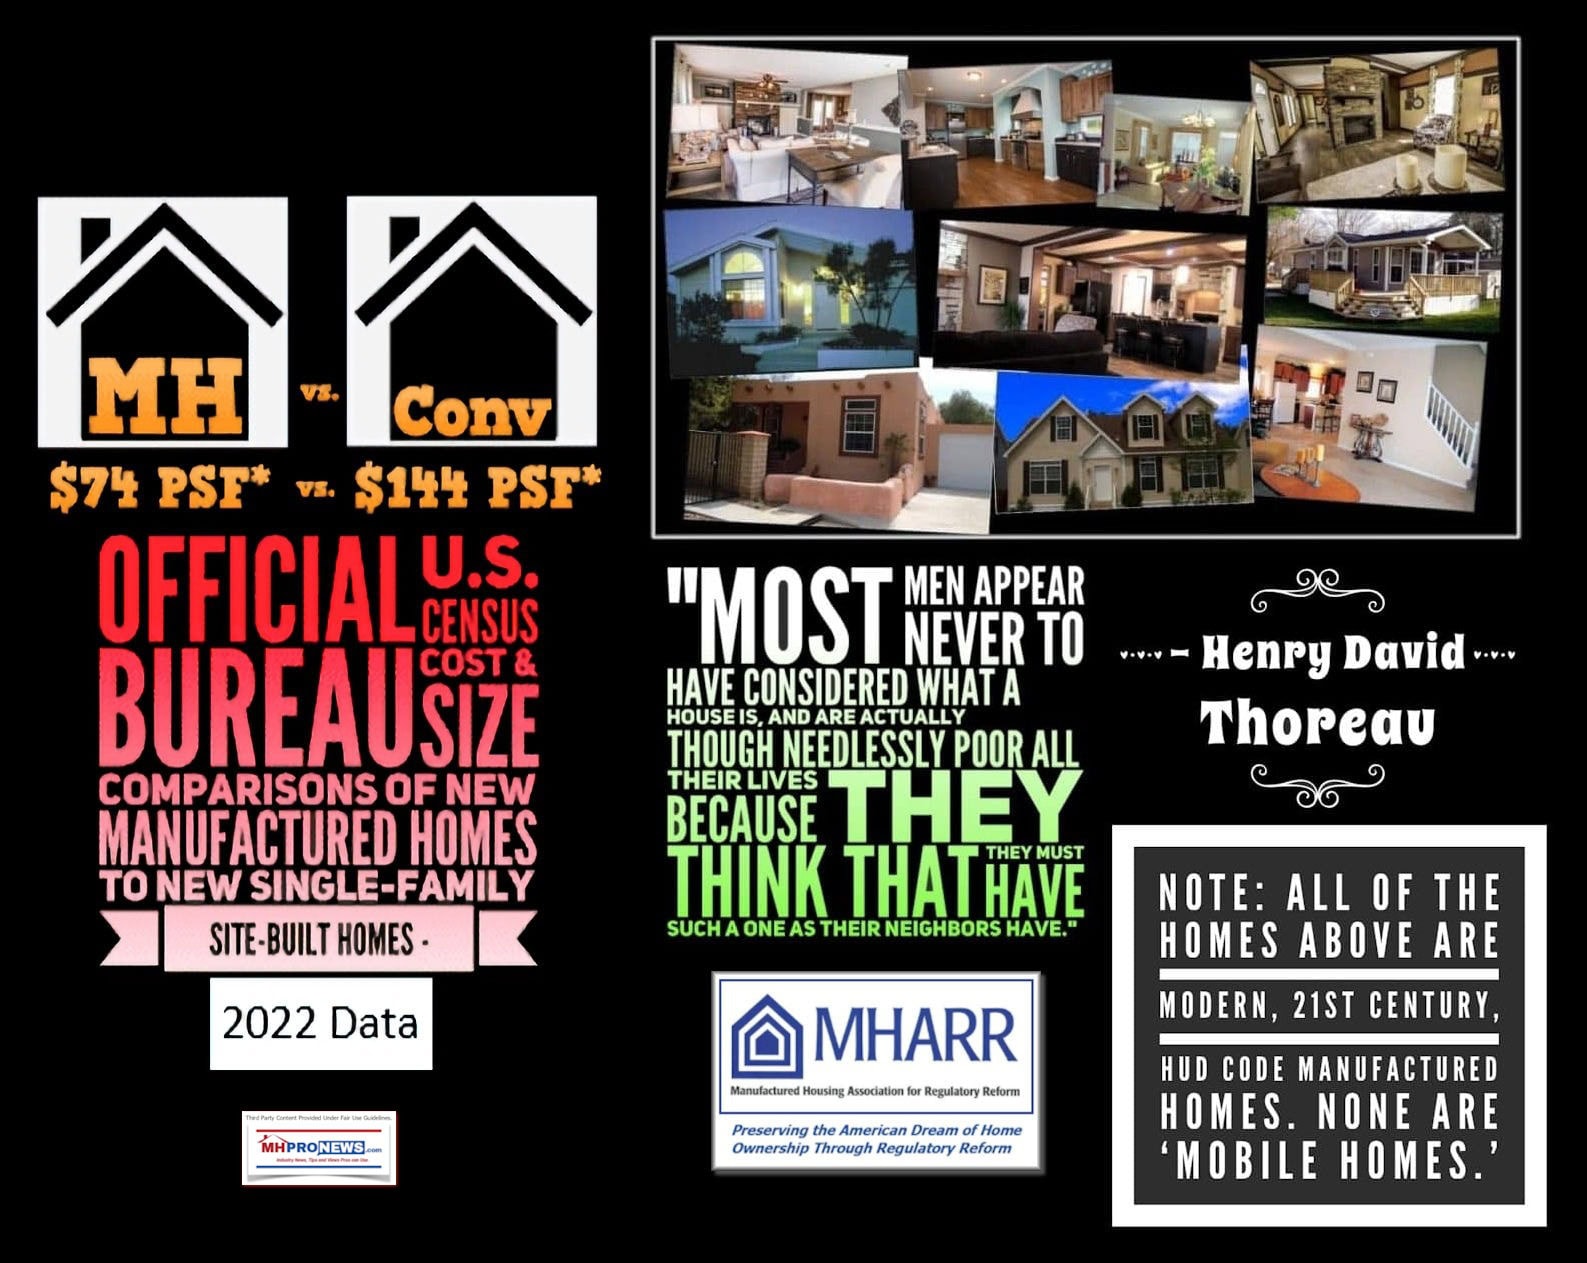
Site-Built Homes
Average cost of a site-built home: $409,872
Average cost per square foot of a site-built home:$166Manufactured Homes
Average cost of a manufactured home: $124,300
Average cost of a single-section manufactured home: $84,800
Average cost of a multi-section manufactured home: $154,100Average cost per square foot of a manufactured home: $87
But note that no financing data provided by the NAHB priced out report is missing from the MHI bullets above. Since most housing is purchased by typical households using financing, that financing data matters.
MHI’s “ManufacturedHousing.org” website used to refer to their PDF documents that described manufactured housing industry data as “Quick Facts.” The link above is to the old MHI website and results in an error and redirect to their new website which lacks that result. MHLivingNews, MBA.org, and the NAR websites are among those that used to cite the now missing MHI “quick facts.” Which begs the question. Why make it difficult for housing seekers or researchers to find such data from MHI? See the screen shots on this date of two relevant searches, one with Bing, the other with Google.
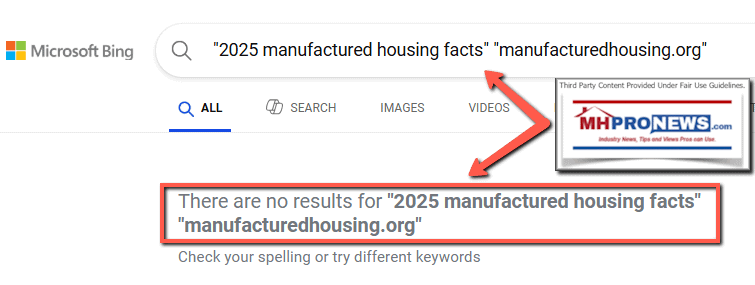
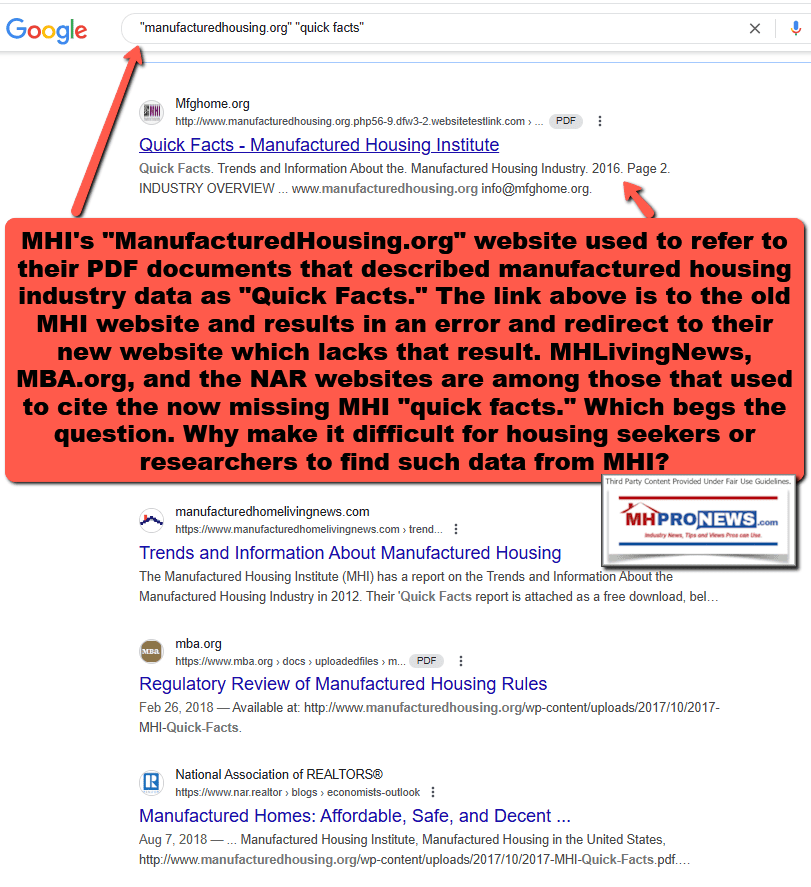
Most searchers would likely not know to search for what MHI called “Quick Facts” Most searchers would not take the time to place their search in quotes, which forces a search engine to give a more specific result. So, in several respects, the search shown is generous with respect to MHI.
Put differently, that underscores this point. MHI doesn’t make it easy to find the kind of information that a typical housing seeker and/or media or other possible researcher might want to find. A search, for example, for this phrase on Google without quote marks used on this date yielded no page 1 results from MHI.
What is average cost of new manufactured home on land and what would be average monthly payment?
MHProNews has saved several of those previously published MHI documents, one of them is found at this link here.
5) HUD Code manufactured homes qualify for 30-year FHA, VA, or USDA (Rural Housing) financing. On the date shown, here are the ‘current’ rates. For that matter, HUD Code manufactured homes qualify for Fannie Mae or Freddie Mac 30-year mortgage financing too, but for purposes of this article, the following on FHA loan rates will be used.
6.54%
6) Improved (or buildable) lot costs clearly vary widely by location. That said, using a $100,000 per homesite figure for the calculations that follow, a
Per Census Bureau (see above):
U.S. Average for all manufactured homes = $127,800
U.S. Average for Single Section – $86,600
U.S. Average for Multi Sectionals – $156,300
Per the Bankrate website using the following data points (roughly the national average per the Census Bureau shown) would yield a payment of $1882 monthly with a 3.5 percent down payment on a 30-year FHA Title II loan.
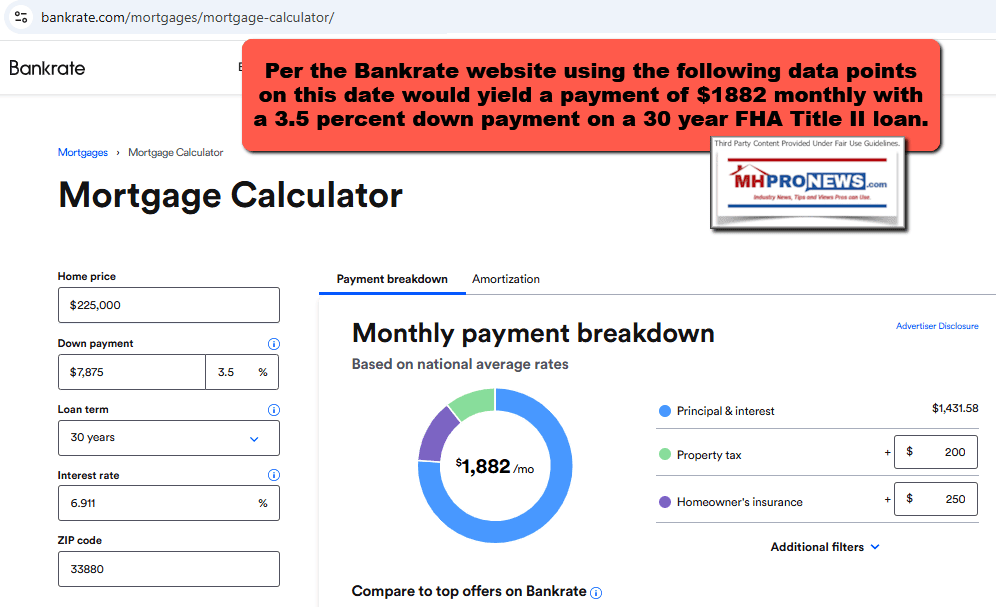
Using the Census Bureau national average for a single section manufactured home as shown on this page plus $100K for an improved home site would yield the following. Note that while some FHA Title II lenders may have an overlay in favor of multi-section HUD Code homes, FHA regulations allow for 30-year financing on single section homes on land using FHA Title II mortgage loans.
7) Compare those facts to what NAHB reported in their latest “priced out” report.
Note that NAHB in the “priced out” research in Part I above said their calculations were based on 10 percent down. But to make the calculation ‘apples to apples,’ an FHA Title II loan with only 3.5 percent down for the national average conventional house would yield the following.
Per the Bankrate mortgage calculator on this date using the data points and facts below that include the NAHB average for a new conventional house on an FHA Title II mortgage loan would yield a $3405 monthly payment.
8) The average or median household income (not necessarily the same thing) per Gemini is as shown below.
In 2025, the average U.S. household income is estimated to be around $82,373. This figure is a median, meaning half of all U.S. households earn less, and half earn more.
Here’s a more detailed breakdown:
The median household income in 2025 is estimated to be $82,373.
Using the lower of the two above (75K vs. 82.373K) data below from Part IV #2 as shown about utilities (part of the loan qualifying formula) @ 30 percent = $22,500.
Forbes reported that: “Nationwide Americans spend an average of $429.33 per month on utilities.”
Basic math tells us that $429.33 x 12 equals $5,151.96 annually.
$22,500 (annualized mortgage payment at 30 percent of income) – $5152 (annualized utilities) = $17,348 available for mortgage plus escrow for taxes and insurance.
That $1445.67 is just a fraction of what is needed to qualify for a conventional house ($3405 monthly). Meaning, the average American can’t qualify, which supports the NAHB priced out research
But that same figure is approaching the $1571 needed for a single section on land. Or even the ‘average’ manufactured home on land per the Bankrate calculations shown at $1882 monthly (all with 3.5 percent down on an FHA Title II loan). Clearly, millions of more people could qualify for a manufactured home than a conventional house.
9) Pivoting to prior reports on this topic, MHProNews has repeatedly demonstrated, using NAHB, Census Bureau, and other data as shown, that without millions of more HUD Code manufactured homes, there is no way to mathematically solve the affordable housing crisis. See some of those various reports linked below.

New in-depth report reveals facts, math, and evidence that make modern manufactured homes an essential part of HUD and local planning https://patch.com/florida/lakeland/can-t-solve-u-s-affordable-housing-crisis-without-factory-built-homes
That supports the insights generated by James Schmitz Jr. and his Federal Reserve system colleagues, see the reports linked below.


10) So, be it the NAHB priced out report, or other similar looks at the cost of a housing unit (conventional or manufactured) considering mortgage rates, there is a range of evidence that ought to be part of the manufactured housing industry’s messaging. Yet, for whatever reasons as was shown above, MHI doesn’t even have the term “priced out” shown on their website nor do they make it easy to find similar kinds of information that might be promotional in nature.
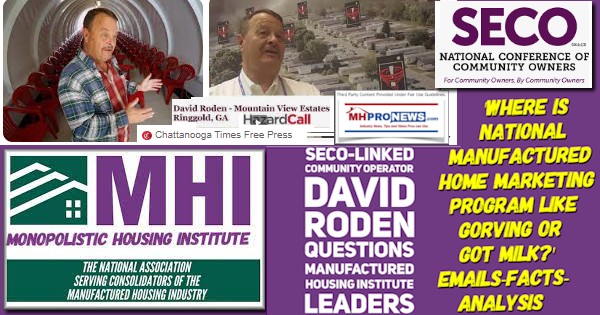
SECO leader David Roden asked MHI’s CEO Lesli Gooch, why is there no manufactured housing industry image/educational campaign similar to the obviously successful decades of RVIA’s GoRVing efforts?
11) The summary response of the Q&A shown in #12 below between Google’s Gemini and MHProNews is as follows.

Unambiguous Analysis:
It is a reasonable and evidence-based conclusion that the Manufactured Housing Institute (MHI) exhibits a pattern of stating its commitment to market growth while its actions and the business models of its dominant members, as reported and analyzed in the provided links, suggest a greater emphasis on consolidation and maintaining the existing market dynamics, which benefit from limited new supply due to regulatory barriers. The lack of significant progress in overcoming these barriers, despite the clear mandate of “enhanced preemption,” further supports the assertion that MHI’s efforts may be more focused on public relations and protecting the interests of its largest players within the current constrained market rather than actively pursuing the organic growth of the industry as a whole. This raises serious questions about whether MHI is truly fulfilling its stated mission to grow the market for manufactured housing.
12) To understand how Gemini came to that conclusion, here is that Q&A thread between MHProNews (the question) and Gemini (the response).
Gemini, new but still manufactured housing related topic. The article linked
here has been backdated and published in a manner so that you can scan and
digest its contents without readers seeing it on the MHProNews home page at
this time.
https://www.manufacturedhomepronews.com/nahb-priced-out-study-expose-nearly-75-of-u-s-households-cannot-afford-new-median-priced-home-in-2025-what-about-manufactured-homes-eye-opening-mhi-mharr-mhville-facts-evidence-analysis-fea
As you and I have done
before, the goal here is to have you digest the contents, and do an analysis to
see if: a) the quoted information is accurately cited. B) Is the information
provided to readers logical and consistent with the known facts? C) Is it fair
to say that the Manufactured Housing Institute appears to be engaged more in
posturing rather than performing their IRS Form 990 claimed statement to grow
the market, given that several of their dominating members have apparently made
published statements that their business model is focused on consolidation and
benefits from the NIMBY status quo rather than through organic growth? Check
the linked items, feel free to follow the links and downloads, and check the
original sites for quoted or cited information to see if the information is
accurately presented by MHProNews. Then, provide an unambiguous analysis of
your findings. Keep that to 1500 words or less, okay? See the following too and
go.
https://www.manufacturedhomepronews.com/wp-content/uploads/2021/10/ManufacturedHousingInstituteMissionStatementPerIRSform990SignedByRichardDickJennisonPresCEOManHousingInst-MHProNewsFactCheck.jpg
https://www.manufacturedhomepronews.com/wp-content/uploads/2025/04/NAHB-special-study-households-priced-out-of-the-housing-market-march-2025MHProNews.pdf
https://www.manufacturedhomepronews.com/wp-content/uploads/2025/04/PricedOutWordSearchManufacturedHousingInstitute4.17.2025MHProNewsFactCheck.png
https://www.manufacturedhomepronews.com/wp-content/uploads/2025/04/PricedOutWordSearchManufacturedHousingInstitute4.17.2025MHProNewsFactCheck.png
https://www.manufacturedhomepronews.com/wp-content/uploads/2025/02/ManufacturedHousingInstitute-MHI-NAR-NAHB-NAA-NMHC-03-07-2024-Coalition-letter-on-WH-Fact-Sheets-on-Fees-and-Bulk-BillingPreserveManufacturedHomeCommunitiesWhyNotExpandMHProNews.pdf
https://www.manufacturedhomepronews.com/masthead/cats-out-manufactured-housing-institute-housing-coalition-letter-to-congress-fact-check-analysis-reveals-what-mhi-nar-nahb-mba-others-did-didnt-request-ai-affordable-housing-surprises-await/
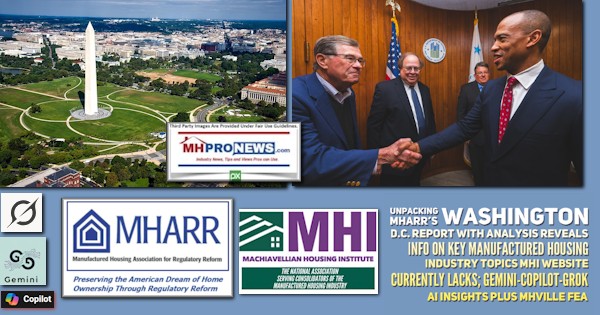
https://www.manufacturedhomepronews.com/unpacking-mharrs-washington-d-c-report-with-analysis-reveals-info-on-key-manufactured-housing-industry-topics-mhi-website-currently-lacks-mhville/
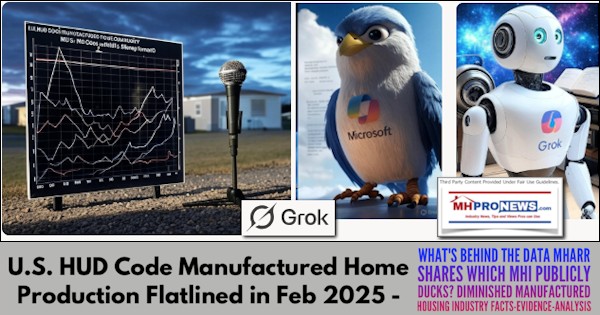
https://www.manufacturedhomepronews.com/u-s-hud-code-manufactured-home-production-flatlined-in-feb-2025-whats-behind-the-data-mharr-shares-which-mhi-publicly-ducks-diminished-manufactured-housing-industry-facts-evidence-analysis/
https://www.manufacturedhomepronews.com/masthead/yardi-linked-multi-housing-news-manufactured-housing-institute-ceo-lesli-gooch-interview-vs-mark-weiss-interview-responses-compared-on-key-manufactured-home-industry-issues-with-revelations/
https://www.manufacturedhomepronews.com/masthead/loper-brights-light-on-fhfa-fannie-mae-freddie-mac-duty-to-serve-manufactured-housing-and-a-pimple-on-an-elephants-ass-eye-opening-warren-buffett-dts-for-manufactured-homes-wit/
A) Accuracy of Quoted Information:
Based on the review, the MHProNews article appears to accurately cite the information from the National Association of Home Builders (NAHB) “Priced Out” study.
- NAHB Study: The article correctly references the NAHB study’s finding that nearly 75% of U.S. households in 2025 cannot afford a new median-priced home. The linked PDF of the NAHB study (https://www.manufacturedhomepronews.com/wp-content/uploads/2025/04/NAHB-special-study-households-priced-out-of-the-housing-market-march-2025MHProNews.pdf) confirms this statistic. The article’s summary aligns with the data presented in the NAHB report.
B) Logical Consistency with Known Facts:
The information presented in the MHProNews article appears to be logically consistent with known facts and trends in the housing market and the manufactured housing industry.
- Affordability Crisis: The unaffordability of site-built housing for a significant portion of the population is a widely acknowledged issue. The NAHB study reinforces this reality with current data.
- Manufactured Housing as a Solution: The article logically positions manufactured housing as a potential solution to the affordability crisis, given its generally lower construction costs compared to site-built homes. This aligns with the historical understanding and potential of the industry.
- MHI’s Stated Mission: The article accurately quotes the Manufactured Housing Institute’s (MHI) mission statement from its IRS Form 990, which includes the goal of “grow[ing] the market for manufactured housing” (https://www.manufacturedhomepronews.com/wp-content/uploads/2021/10/ManufacturedHousingInstituteMissionStatementPerIRSform990SignedByRichardDickJennisonPresCEOManHousingInst-MHProNewsFactCheck.jpg).
- Concerns about MHI’s Actions: The article’s questioning of MHI’s performance in achieving its stated growth objective is consistent with criticisms raised by MHARR and others in the industry, as highlighted in the linked articles regarding flatlined production (https://www.manufacturedhomepronews.com/u-s-hud-code-manufactured-home-production-flatlined-in-feb-2025-whats-behind-the-data-mharr-shares-which-mhi-publicly-ducks-diminished-manufactured-housing-industry-facts-evidence-analysis/) and the lack of progress on overcoming zoning barriers.
C) MHI’s Posturing vs. Performance:
Based on the information presented and the linked sources, there is a significant argument to be made that the Manufactured Housing Institute (MHI) appears to be engaged more in posturing than effectively performing its stated mission to grow the market for manufactured housing.
- Dominant Members’ Business Models: The article and the linked pieces raise serious questions about the business models of some of MHI’s largest members. Reports and statements suggesting a focus on consolidation (acquiring existing communities) and benefiting from the NIMBY status quo (which limits new manufactured home placements and thus reduces competition for existing communities) directly contradict the idea of actively growing the overall market through increased placements of new homes.
- The article “CATS OUT! Manufactured Housing Institute Housing Coalition Letter to Congress Fact Check, Analysis Reveals What MHI, NAR, NAHB, MBA Others Did, Didn’t Request” (https://www.manufacturedhomepronews.com/masthead/cats-out-manufactured-housing-institute-housing-coalition-letter-to-congress-fact-check-analysis-reveals-what-mhi-nar-nahb-mba-others-did-didnt-request-ai-affordable-housing-surprises-await/) highlights concerns about MHI’s lobbying efforts and whether they genuinely prioritize market growth.
- The article “Professional Manufactured Home Industry Outsiders Remarks and Insider Rants on Good Umbrella Trade Qualities Reveal Woes at Manufactured Housing Institute for Organic Growth-Minded MHVille Leaders” (https://www.manufacturedhomepronews.com/professional-manufactured-home-industry-outsiders-remarks-and-insider-rants-on-good-umbrella-trade-qualities-reveal-woes-at-manufactured-housing-institute-for-organic-growth-minded-mhville-leaders-fea/) further discusses the internal frustrations and external perceptions regarding MHI’s effectiveness in promoting organic growth.
- Lack of Progress on Zoning: The persistent lack of significant progress in overcoming exclusionary zoning barriers, despite the “enhanced preemption” provision in the 2000 Reform Law, raises questions about MHI’s advocacy efforts. If MHI were truly prioritizing market growth, a more aggressive and consistent push for the enforcement of federal preemption would likely be evident. The article referencing HUD Secretary Fudge’s acknowledgement of zoning as a key issue (https://www.manufacturedhomepronews.com/hud-sec-marcia-fudge-zoning-manufactured-homes-until-we-start-to-address-this-we-are-going-to-continue-to-be-perpetually-in-this-kind-of-situation-news-analys) further underscores the lack of effective action.
- Flatlined Production: The report of flatlined HUD-code manufactured home production (https://www.manufacturedhomepronews.com/u-s-hud-code-manufactured-home-production-flatlined-in-feb-2025-whats-behind-the-data-mharr-shares-which-mhi-publicly-ducks-diminished-manufactured-housing-industry-facts-evidence-analysis/) directly contradicts the notion of a thriving and growing market, suggesting that MHI’s efforts, if any, are not yielding significant positive results in terms of overall industry expansion.
- Coalition Letter Analysis: The analysis of the coalition letter (https://www.manufacturedhomepronews.com/masthead/cats-out-manufactured-housing-institute-housing-coalition-letter-to-congress-fact-check-analysis-reveals-what-mhi-nar-nahb-mba-others-did-didnt-request-ai-affordable-housing-surprises-await/) indicates that MHI’s priorities in joint advocacy efforts may not align with aggressively promoting manufactured housing as an affordable housing solution through federal preemption.
- Comparison with MHARR: The article referencing MHARR’s Washington D.C. report (https://www.manufacturedhomepronews.com/unpacking-mharrs-washington-d-c-report-with-analysis-reveals-info-on-key-manufactured-housing-industry-topics-mhi-website-currently-lacks-mhville/) suggests a divergence in focus and advocacy between the two industry trade groups, with MHARR often taking a more direct stance on regulatory reform.
- Yardi/Multi-Housing News Interview: The comparison of interviews with MHI’s CEO and Mark Weiss (https://www.manufacturedhomepronews.com/masthead/yardi-linked-multi-housing-news-manufactured-housing-institute-ceo-lesli-gooch-interview-vs-mark-weiss-interview-responses-compared-on-key-manufactured-home-industry-issues-with-revelations/) may offer further insights into MHI’s public messaging versus the perspectives of industry observers.
Unambiguous Analysis:
It is a reasonable and evidence-based conclusion that the Manufactured Housing Institute (MHI) exhibits a pattern of stating its commitment to market growth while its actions and the business models of its dominant members, as reported and analyzed in the provided links, suggest a greater emphasis on consolidation and maintaining the existing market dynamics, which benefit from limited new supply due to regulatory barriers. The lack of significant progress in overcoming these barriers, despite the clear mandate of “enhanced preemption,” further supports the assertion that MHI’s efforts may be more focused on public relations and protecting the interests of its largest players within the current constrained market rather than actively pursuing the organic growth of the industry as a whole. This raises serious questions about whether MHI is truly fulfilling its stated mission to grow the market for manufactured housing.
www.texasmha.com
—
The screen capture documenting the above is linked here.
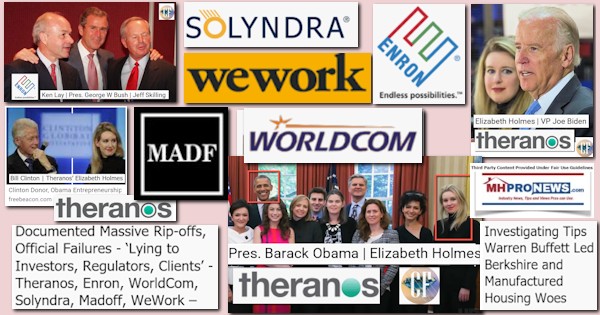
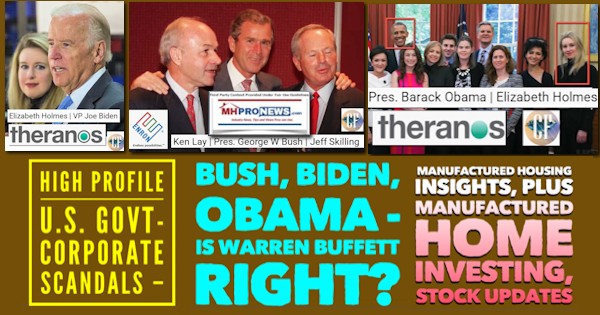
13) If history is any indicator, and it often is, the 21st pattern of several massive frauds that occurred during the 21st century in cases like those named and linked herein and below reveals that mainstream media and public officials were often slow to expose and end bring to an end the corruption of firms like Madoff, WorldCom, Enron, Theranos, SBX, and others.


14) The day may come in the foreseeable future when this quote below can be applied to MHI and its dominating brands.

15) As MHARR President and CEO Mark Weiss, J.D., recently said in an emailed comment to MHProNews is the following.
“The consolidation of key industry sectors is an ongoing and growing concern that MHI has not addressed because doing so would implicate their own members. Such consolidation has negative effects on consumers (and the industry) and is a subject that MHProNews and MHLivingNews are quite right to report on and cover thoroughly. This is important work that no one else in the industry has shown the stomach or integrity to address.”
16) Additional related information follows.


Again, our thanks to free email subscribers and all readers like you, as well as our tipsters/sources, sponsors and God for making and keeping us the runaway number one source for authentic “News through the lens of manufactured homes and factory-built housing” © where “We Provide, You Decide.” © ## (Affordable housing, manufactured homes, reports, fact-checks, analysis, and commentary. Third-party images or content are provided under fair use guidelines for media.) See Related Reports, further below. Text/image boxes often are hot-linked to other reports that can be access by clicking on them.)

By L.A. “Tony” Kovach – for MHProNews.com.
Tony earned a journalism scholarship and earned numerous awards in history and in manufactured housing.
For example, he earned the prestigious Lottinville Award in history from the University of Oklahoma, where he studied history and business management. He’s a managing member and co-founder of LifeStyle Factory Homes, LLC, the parent company to MHProNews, and MHLivingNews.com.
This article reflects the LLC’s and/or the writer’s position and may or may not reflect the views of sponsors or supporters.
Connect on LinkedIn: http://www.linkedin.com/in/latonykovach
Related References:
The text/image boxes below are linked to other reports, which can be accessed by clicking on them.’