“Middle income home buyers in the United States are finding little on the market to buy, even if they can qualify and afford a mortgage, according to a new analysis from the National Association of Realtors” said the NAR in a recent tweet. Nobility Homes and Legacy Housing have each reported sales data that bucked the national trends claimed by the Manufactured Housing Institute (MHI) and some of their Big Three manufactured home producers have apparently supported. The National Association of Home Builders (NAHB) said on 6.19.2023 that “Home builder confidence rose 5 points in June to a level of 55 in the NAHB/@WellsFargo Housing Market Index (HMI), marking the first time builder confidence has been in positive territory since July 2022.” Restated, there is plenty of evidence that manufactured housing ought to be collectively roaring. But that is obviously not the case. Instead, manufactured housing is in its 7th month of an apparently accelerating slump. How is that possible? The Manufactured Housing Association for Regulatory Reform (MHARR) has advanced their data-supported hypothesis. To better understand just how odd the manufactured housing industry downturn is, the latest data from the U.S. Census Bureau should prove helpful.
Part I – U.S. Census Bureau Data on HUD Code Manufactured Housing by Region, Size, Month
Part II – Additional Information with More MHProNews Analysis and Commentary (note the markets were closed on Monday, 6.19.2023 for the Juneteenth federal holiday, so there is no market recap today.
Part I.
| Average Sales Price of New Manufactured Homes | ||||||||||||||||||||||||||||||||||||||||||||||||||||||||||||||||||||||||||||||||||||||||||||||||||||||||||||||||||||||||||||||||||||||||||||||||||||||||||||||||||||||||||||||||||||||||||||||||||||||||||||||||||||||||||||||||||||||||||||||||||||||||||||||||||||||||||||||||||||||||||||||||||||||||||||||||||||||||||||||||||||||||||||||||||||||||||||||||||||||||||||||||||||||||||||
| by Region, Size of Home and | ||||||||||||||||||||||||||||||||||||||||||||||||||||||||||||||||||||||||||||||||||||||||||||||||||||||||||||||||||||||||||||||||||||||||||||||||||||||||||||||||||||||||||||||||||||||||||||||||||||||||||||||||||||||||||||||||||||||||||||||||||||||||||||||||||||||||||||||||||||||||||||||||||||||||||||||||||||||||||||||||||||||||||||||||||||||||||||||||||||||||||||||||||||||||||||
| by Month of Shipment | ||||||||||||||||||||||||||||||||||||||||||||||||||||||||||||||||||||||||||||||||||||||||||||||||||||||||||||||||||||||||||||||||||||||||||||||||||||||||||||||||||||||||||||||||||||||||||||||||||||||||||||||||||||||||||||||||||||||||||||||||||||||||||||||||||||||||||||||||||||||||||||||||||||||||||||||||||||||||||||||||||||||||||||||||||||||||||||||||||||||||||||||||||||||||||||
|
(Dollars) |
||||||||||||||||||||||||||||||||||||||||||||||||||||||||||||||||||||||||||||||||||||||||||||||||||||||||||||||||||||||||||||||||||||||||||||||||||||||||||||||||||||||||||||||||||||||||||||||||||||||||||||||||||||||||||||||||||||||||||||||||||||||||||||||||||||||||||||||||||||||||||||||||||||||||||||||||||||||||||||||||||||||||||||||||||||||||||||||||||||||||||||||||||||||||||||
|
||||||||||||||||||||||||||||||||||||||||||||||||||||||||||||||||||||||||||||||||||||||||||||||||||||||||||||||||||||||||||||||||||||||||||||||||||||||||||||||||||||||||||||||||||||||||||||||||||||||||||||||||||||||||||||||||||||||||||||||||||||||||||||||||||||||||||||||||||||||||||||||||||||||||||||||||||||||||||||||||||||||||||||||||||||||||||||||||||||||||||||||||||||||||||||
Figures are in U.S. Dollars.
| Northeast | Midwest | South | West | |||||||||
| Total1 | Single | Double | Total1 | Single | Double | Total1 | Single | Double | Total1 | Single | Double | |
| 2023 | ||||||||||||
| January | 122,900 | 86,700 | 148,300 | 107,200 | 83,600 | 153,100 | 129,200 | 81,200 | 158,300 | 131,500 | 81,300 | 156,700 |
| 2022 | ||||||||||||
| December | 113,900 | 75,300 | 158,300 | 104,700 | 82,300 | 144,300 | 124,000 | 80,700 | 155,400 | 134,700 | 77,600 | 162,400 |
| November | 119,200 | 93,900 | 146,700 | 113,600 | 89,100 | 147,600 | 126,000 | 86,500 | 155,800 | 138,400 | 89,500 | 161,800 |
| October | 127,000 | 86,400 | 155,300 | 113,500 | 87,500 | 156,700 | 128,100 | 77,000 | 160,000 | 153,600 | 86,200 | 167,300 |
| September | 131,300 | 101,400 | 162,000 | 114,600 | 93,000 | 155,500 | 130,300 | 94,400 | 158,500 | 148,600 | 107,500 | 163,900 |
| August | 117,800 | 74,700 | 145,100 | 110,900 | 87,500 | 151,900 | 126,400 | 86,000 | 159,400 | 144,100 | 93,400 | 166,400 |
| July | 129,700 | 93,300 | 157,400 | 110,800 | 83,600 | 156,100 | 131,300 | 82,900 | 158,700 | 156,800 | 97,300 | 178,200 |
| June | 118,500 | 92,700 | 134,100 | 112,500 | 90,100 | 146,500 | 125,300 | 88,200 | 159,900 | 154,200 | 68,400 | 174,500 |
| May | 121,500 | 82,100 | 148,500 | 112,300 | 83,600 | 148,800 | 124,400 | 85,900 | 162,400 | 142,000 | 91,900 | 156,100 |
| April | 128,900 | 87,200 | 154,700 | 110,400 | 80,500 | 147,800 | 132,100 | 83,500 | 169,900 | 155,400 | 82,400 | 176,600 |
| March | 117,900 | 97,400 | 145,300 | 118,500 | 90,000 | 154,200 | 127,400 | 85,200 | 154,400 | 156,100 | 89,800 | 171,600 |
| February | 130,600 | 76,000 | 152,700 | 115,900 | 82,400 | 155,500 | 126,300 | 89,500 | 155,000 | 150,100 | 85,100 | 163,600 |
| January | 120,600 | 85,900 | 141,800 | 108,300 | 82,800 | 145,400 | 122,700 | 85,400 | 153,300 | 140,800 | 80,700 | 161,000 |
| 2021 | ||||||||||||
| December | 104,700 | 73,900 | 127,200 | 103,300 | 88,200 | 129,400 | 123,500 | 80,000 | 149,600 | 145,200 | 76,900 | 170,600 |
| November | 100,900 | 71,600 | 133,500 | 107,300 | 78,100 | 143,800 | 110,700 | 77,000 | 138,400 | 128,800 | 68,400 | 145,500 |
| October | 110,300 | 74,400 | 138,700 | 101,000 | 81,000 | 132,600 | 110,700 | 81,900 | 136,400 | 131,600 | 85,000 | 150,400 |
| September | 102,100 | 76,100 | 124,100 | 109,300 | 80,900 | 142,300 | 119,300 | 78,500 | 142,200 | 132,100 | 76,200 | 141,600 |
| August | 105,000 | 86,000 | 117,000 | 100,000 | 77,000 | 132,000 | 112,000 | 80,000 | 139,000 | 135,000 | 79,000 | 143,000 |
| July | 98,500 | 74,100 | 125,700 | 110,500 | 79,100 | 139,300 | 119,200 | 74,500 | 137,100 | 131,100 | 81,700 | 142,800 |
| June | 101,600 | 73,700 | 124,200 | 94,900 | 65,600 | 125,800 | 107,500 | 70,700 | 128,000 | 116,400 | 72,200 | 131,500 |
| May | 98,400 | 69,900 | 121,500 | 94,300 | 67,500 | 128,200 | 109,900 | 70,600 | 129,200 | 104,400 | 70,300 | 125,500 |
| April | 95,900 | 73,800 | 113,300 | 85,400 | 61,800 | 125,400 | 100,400 | 67,700 | 122,200 | 118,400 | 65,000 | 125,000 |
| March | 91,400 | 58,600 | 121,300 | 86,400 | 60,800 | 119,100 | 98,100 | 63,700 | 122,400 | 113,000 | 67,300 | 130,800 |
| February | 88,300 | 59,400 | 113,800 | 87,300 | 62,400 | 118,100 | 98,100 | 67,100 | 121,800 | 116,900 | 60,900 | 131,900 |
| January | 102,600 | 67,900 | 116,200 | 83,000 | 62,100 | 112,700 | 94,000 | 64,600 | 117,300 | 113,400 | 62,300 | 129,500 |
| 2020 | ||||||||||||
| December | 93,600 | 58,200 | 115,300 | 77,100 | 55,800 | 107,900 | 90,100 | 64,500 | 109,900 | 108,800 | 64,500 | 115,900 |
| November | 85,600 | 63,600 | 103,900 | 81,000 | 62,400 | 117,400 | 92,600 | 64,200 | 109,700 | 115,400 | 60,100 | 128,200 |
| October | 91,000 | 57,700 | 112,100 | 81,700 | 58,300 | 108,000 | 87,400 | 56,500 | 107,900 | 108,900 | 61,200 | 120,000 |
| September | 84,800 | 61,000 | 105,600 | 72,100 | 52,800 | 98,300 | 86,900 | 58,400 | 105,700 | 110,100 | 68,600 | 126,600 |
| August | 87,600 | 56,700 | 109,600 | 75,900 | 59,500 | 97,600 | 87,900 | 56,800 | 109,100 | 104,900 | 60,500 | 119,500 |
| July | 78,600 | 58,600 | 100,300 | 72,600 | 56,900 | 97,000 | 83,700 | 59,500 | 101,300 | 103,700 | 72,100 | 113,200 |
| June | 91,700 | 55,400 | 117,000 | 81,400 | 56,100 | 115,200 | 82,700 | 51,700 | 106,800 | 102,700 | 55,600 | 117,000 |
| May | 79,100 | 56,300 | 100,200 | 73,400 | 56,800 | 100,900 | 85,200 | 54,100 | 108,500 | 105,100 | 60,700 | 117,800 |
| April | 86,100 | 53,900 | 105,200 | 79,500 | 57,000 | 105,000 | 84,000 | 51,600 | 106,100 | 111,800 | 64,500 | 120,300 |
| March | 79,100 | 54,400 | 102,400 | 79,200 | 55,300 | 108,400 | 82,000 | 53,300 | 106,900 | 92,600 | 54,300 | 106,700 |
| February | 81,500 | 54,000 | 109,800 | 70,900 | 55,200 | 98,200 | 82,000 | 55,300 | 105,600 | 103,500 | 59,600 | 118,900 |
| January | 77,700 | 52,900 | 104,800 | 74,200 | 55,400 | 101,800 | 86,200 | 55,200 | 108,100 | 103,400 | 59,900 | 111,300 |
| 2019 | ||||||||||||
| December | 79,500 | 54,000 | 98,500 | 70,200 | 54,400 | 96,100 | 87,900 | 54,600 | 106,900 | 97,700 | 52,100 | 107,600 |
| November | 79,200 | 49,400 | 113,100 | 73,400 | 50,600 | 104,000 | 79,500 | 52,500 | 104,800 | 101,400 | 54,100 | 114,700 |
| October | 80,600 | 61,200 | 101,600 | 72,100 | 53,800 | 100,200 | 81,600 | 52,500 | 103,400 | 96,600 | 58,800 | 109,100 |
| September | 84,100 | 59,600 | 103,700 | 71,900 | 55,900 | 98,400 | 80,200 | 55,100 | 99,300 | 99,500 | 55,300 | 113,000 |
| August | 81,900 | 45,700 | 101,200 | 75,700 | 52,500 | 99,800 | 81,400 | 48,700 | 106,600 | 107,500 | 48,200 | 120,700 |
| July | 88,000 | 51,600 | 129,500 | 74,400 | 53,900 | 105,700 | 78,100 | 54,900 | 100,300 | 108,400 | 45,700 | 121,000 |
| June | 84,800 | 57,800 | 109,100 | 72,600 | 52,700 | 97,100 | 83,400 | 53,200 | 100,500 | 100,600 | 47,000 | 118,800 |
| May | 76,400 | 49,200 | 105,200 | 72,300 | 56,000 | 98,100 | 75,800 | 53,600 | 95,000 | 96,300 | 55,000 | 106,800 |
| April | 82,000 | 59,300 | 109,000 | 70,800 | 56,700 | 91,900 | 77,100 | 54,000 | 99,300 | 95,400 | 63,600 | 109,100 |
| March | 74,500 | 48,000 | 98,400 | 71,300 | 49,900 | 96,300 | 77,800 | 50,900 | 101,600 | 92,900 | 49,100 | 108,500 |
| February | 74,100 | 52,300 | 97,500 | 72,500 | 56,000 | 97,200 | 84,800 | 52,600 | 106,600 | 103,100 | 43,500 | 119,400 |
| January | 86,600 | 60,100 | 109,000 | 68,000 | 54,200 | 98,000 | 81,100 | 51,400 | 101,700 | 95,800 | 59,000 | 110,400 |
| 2018 | ||||||||||||
| December | 79,600 | 57,500 | 93,600 | 74,300 | 53,800 | 96,400 | 80,100 | 51,500 | 104,900 | 101,400 | 51,600 | 120,400 |
| November | 81,400 | 52,300 | 104,700 | 74,100 | 56,200 | 101,900 | 77,100 | 54,600 | 97,800 | 99,300 | 62,600 | 107,800 |
| October | 81,600 | 59,300 | 96,200 | 73,100 | 56,700 | 94,300 | 79,800 | 53,500 | 105,900 | 105,100 | 57,300 | 116,500 |
| September | 78,800 | 57,600 | 97,300 | 76,700 | 58,300 | 105,500 | 81,600 | 51,900 | 104,500 | 102,600 | 62,000 | 111,600 |
| August | 82,900 | 58,400 | 113,000 | 73,600 | 54,500 | 97,800 | 79,800 | 54,500 | 98,100 | 97,400 | 57,600 | 110,300 |
| July | 73,600 | 33,900 | 100,600 | 79,600 | 57,300 | 104,500 | 74,900 | 51,300 | 94,000 | 102,800 | 59,300 | 118,200 |
| June | 82,400 | 52,900 | 97,500 | 77,400 | 52,700 | 99,700 | 83,200 | 55,100 | 97,100 | 105,000 | 57,600 | 122,900 |
| May | 81,700 | 62,400 | 104,300 | 72,500 | 57,600 | 92,900 | 79,000 | 56,300 | 97,000 | 104,000 | 60,300 | 108,900 |
| April | 87,300 | 54,900 | 109,900 | 67,300 | 51,600 | 92,800 | 71,100 | 48,600 | 95,300 | 103,100 | 67,400 | 113,400 |
| March | 70,900 | 50,400 | 96,600 | 67,700 | 50,600 | 93,800 | 68,900 | 50,000 | 88,900 | 82,900 | 45,800 | 98,700 |
| February | 80,400 | 50,800 | 98,200 | 72,100 | 49,700 | 98,000 | 70,600 | 46,700 | 91,200 | 87,100 | 53,900 | 100,600 |
| January | 79,500 | 52,400 | 106,000 | 59,300 | 44,900 | 85,600 | 64,400 | 46,300 | 85,900 | 98,900 | 59,400 | 114,200 |
| 2017 | ||||||||||||
| December | 76,900 | 49,200 | 100,300 | 64,900 | 48,700 | 84,500 | 70,000 | 54,000 | 89,000 | 96,400 | 58,600 | 103,900 |
| November | 75,300 | 49,400 | 107,000 | 68,100 | 48,500 | 90,500 | 65,800 | 45,900 | 91,600 | 114,500 | 49,800 | 130,300 |
| October | 76,300 | 45,100 | 96,900 | 65,600 | 48,600 | 88,600 | 64,200 | 45,700 | 93,600 | 95,200 | 50,900 | 106,900 |
| September | 72,400 | 50,800 | 92,700 | 62,800 | 45,500 | 87,200 | 68,800 | 46,600 | 89,000 | 95,600 | 51,700 | 116,700 |
| August | 70,400 | 50,400 | 88,700 | 65,300 | 48,200 | 88,600 | 72,500 | 47,200 | 91,500 | 91,600 | 46,600 | 110,900 |
| July | 80,700 | 52,500 | 102,100 | 70,900 | 48,200 | 89,400 | 70,300 | 47,900 | 88,400 | 99,700 | 44,500 | 111,900 |
| June | 84,800 | 57,300 | 95,500 | 69,400 | 49,900 | 94,300 | 70,800 | 49,300 | 91,600 | 106,300 | 46,600 | 125,000 |
| May | 78,800 | 55,500 | 93,300 | 64,600 | 45,200 | 84,400 | 68,500 | 49,400 | 84,000 | 94,900 | 47,800 | 104,500 |
| April | 79,600 | 53,800 | 100,200 | 63,900 | 47,800 | 84,500 | 70,900 | 45,500 | 86,600 | 93,000 | 57,200 | 104,300 |
| March | 76,900 | 56,700 | 100,700 | 64,500 | 49,600 | 83,900 | 67,000 | 50,700 | 84,600 | 89,800 | 49,400 | 99,400 |
| February | 86,500 | 48,700 | 96,300 | 61,500 | 46,800 | 84,700 | 66,200 | 48,400 | 87,300 | 104,200 | 59,000 | 115,100 |
| January | 84,700 | 59,900 | 99,600 | 59,800 | 45,800 | 85,100 | 64,600 | 44,000 | 85,900 | 93,600 | 45,800 | 107,100 |
| 2016 | ||||||||||||
| December | 73,900 | 44,200 | 92,800 | 67,100 | 45,000 | 85,800 | 71,400 | 50,100 | 89,000 | 85,900 | 56,000 | 101,500 |
| November | 70,800 | 45,500 | 94,000 | 58,900 | 46,500 | 84,700 | 72,100 | 47,100 | 88,000 | 89,200 | 48,100 | 108,900 |
| October | 75,300 | 45,700 | 90,700 | 60,200 | 47,600 | 81,300 | 71,300 | 47,500 | 84,700 | 85,100 | 54,100 | 104,000 |
| September | 79,600 | 55,400 | 101,800 | 62,400 | 46,100 | 96,500 | 65,300 | 45,400 | 89,300 | 93,900 | 58,000 | 99,000 |
| August | 86,100 | 57,500 | 106,600 | 60,800 | 45,500 | 84,300 | 71,600 | 46,100 | 91,300 | 95,000 | 79,900 | 99,600 |
| July | 73,900 | 53,400 | 103,600 | 65,900 | 48,200 | 91,700 | 70,200 | 47,700 | 87,100 | 96,800 | 67,700 | 100,600 |
| June | 85,000 | 50,900 | 113,700 | 61,500 | 45,100 | 84,100 | 66,800 | 44,900 | 81,500 | 89,000 | 57,100 | 100,300 |
| May | 75,900 | 45,900 | 99,600 | 63,500 | 46,700 | 86,600 | 69,800 | 45,000 | 84,600 | 83,500 | 48,000 | 96,400 |
| April | 78,600 | 45,400 | 100,100 | 61,600 | 45,900 | 86,900 | 64,900 | 42,500 | 85,000 | 85,400 | 53,900 | 92,900 |
| March | 72,800 | 45,100 | 103,200 | 59,200 | 46,200 | 83,200 | 69,600 | 44,100 | 86,300 | 83,200 | 42,500 | 97,000 |
| February | 81,500 | 50,000 | 97,300 | 57,900 | 45,600 | 85,100 | 65,300 | 43,000 | 89,700 | 84,800 | 45,400 | 106,600 |
| January | 69,400 | 48,100 | 90,700 | 61,400 | 48,200 | 86,800 | 65,200 | 44,600 | 80,200 | 86,900 | 50,000 | 96,100 |
Part II – Additional Information with More MHProNews Analysis and Commentary in Brief
The following tweets are from the National Association of Realtors (NAR).
Instant Reaction: Mortgage rates fell for the second straight week, but they continue to remain above 6.5%. According to Freddie Mac, the average rate on a 30-year fixed mortgage ticked down to 6.69% from 6.71% the previous week. https://t.co/bakJGBq80U pic.twitter.com/VkHwL8DW69
— NAR Research (@NAR_Research) June 15, 2023
Middle income home buyers in the United States are finding little on the market to buy, even if they can qualify and afford a mortgage, according to a new analysis from the National Association of Realtors and https://t.co/KewaiX35oX. https://t.co/AEDnrG0KP7
— NAR Research (@NAR_Research) June 10, 2023
Lawrence Yun notes “homeownership is a catalyst for building wealth for people from all walks of life. A monthly mortgage payment is often considered a forced savings account that helps homeowners build a net worth about 40x higher than that of a renter.” https://t.co/dCeRdD5Lmn
— NAR Research (@NAR_Research) June 6, 2023
Realtors® strive to ensure all Americans have the opportunity to achieve #homeownership, the centerpiece of the American dream and the pathway to economic well-being and intergenerational wealth-building.@NAR_Research‘s homeownership trends: https://t.co/Ozn3uWzyD8 pic.twitter.com/b5ngfP47l2
— PA Realtors® (@PARealtors) June 6, 2023
Note that despite inventory challenges far more costly conventional housing has been essentially flat for months, with two months of increases. That stands in stark contrast to the 7 month drop in HUD Code manufactured housing. More on that further below.
The pending home sales pace in April 2023 showed no movement from the previous month but fell 20.3% from a year ago. https://t.co/OluN9yptrS #NARPHS
— NAR Research (@NAR_Research) May 28, 2023
In April 2023, there was no change in pending home sales month-over-month. https://t.co/ufVmcqhKnO #NARPHS pic.twitter.com/shNkfz1sXr
— NAR Research (@NAR_Research) May 27, 2023
April 2023 brought 4.28 million in sales, a median sales price of $388,800, and 2.9 months of inventory, said the NAR. Even figuring in the cost of a homesite, a new HUD Code manufactured home may be a fraction of the cost of an existing conventional house.
Next, let’s look at what the National Association of Home Builders (NAHB) said.
Home builder confidence rose 5 points in June to a level of 55 in the NAHB/@WellsFargo Housing Market Index (HMI), marking the first time builder confidence has been in positive territory since July 2022. https://t.co/la1uiyrlIR | #realestate #homebuilding #economy pic.twitter.com/lDIyUzfJHu
— NAHB 🏠 (@NAHBhome) June 19, 2023
On April 25, 2023, the NAHB said: “The median new home sale price rose in March to $449,800, up 3.2% compared to a year ago.”
So, once again, factoring in the cost of a home site and necessary utilities and improvements, someone can own a new HUD Code manufactured home for a fraction of the price of a conventional house. In numbers of scenarios, per federal data, the total cost for buying a new manufactured home with land can be about half that of purchasing a new conventional house.
- Home Bay on April 24, 2023 said: “A new study found that 72% of renters are convinced they’ll never be able to afford a home.”
- The left-leaning Washington Post on April 19, 2022 said: “A recent analysis by Porch, a home services platform, found that 61 percent of renters can’t afford to a buy a home in their city.”
Publicly traded Nobility Homes (NOBH) demonstrated in their latest quarterly report that they have in several ways bucked the trends that MHI and brands such as Cavco Industries (CVCO).
Legacy Housing (LEGH) similarly demonstrated in their most recent quarterly earnings and reporting data that they too have bucked the trends in certain ways.
So, while MHI is producing ‘housing market’ reports that are essentially their ‘defense’ of why manufactured housing is declining in an affordable housing crisis, the facts above from the Census Bureau, NAR, NAHB, Washington Post, and Home Bay demonstrate why manufactured housing ought to be soaring. After all, in the current economic environment with higher interest rates, perhaps 60+ percent of renters can’t afford to buy a conventional house. But some 25-26 million renters, per Freddie Mac, could buy a new HUD Code manufactured home.
Nevertheless, time and again, MHI manages to push (or avoid pressing) positions that harm the manufactured housing industry’s growth potential. See the exclusive report and analysis below.
These facts are difficult for MHI and their leadership to escape. Which may explain why MHI’s leadership would rather duck, dodge, and distract, rather than address the reality head on. Historically, manufactured housing has performed better during higher interest rate eras than it has been during this current period.
Ironically, Cavco Industries (CVCO) has undercut some of MHI’s distraction and dodge claims in several of their recent corporate remarks.
Notice: the graphic below can be expanded to a larger size.
See the instructions below the graphic below or click the image and follow the prompts.

that the industry ought to expect this current downturn because more expensive site built housing is also in a downturn? MHI’s research and reasoning are arguably a classic example of PALTERING and the use of a RED HERRING logical fallacy. Note: depending on your browser or device, many images in this report and others on MHProNews can be clicked to expand. Click the image and follow the prompts. For example, in some browsers/devices you click the image and select ‘open in a new window.’ After clicking that selection you click the image in the open window to expand the image to a larger size. To return to this page, use your back key, escape or follow the prompts.
Notice: the graphic below can be expanded to a larger size.
See the instructions below the graphic below or click the image and follow the prompts.
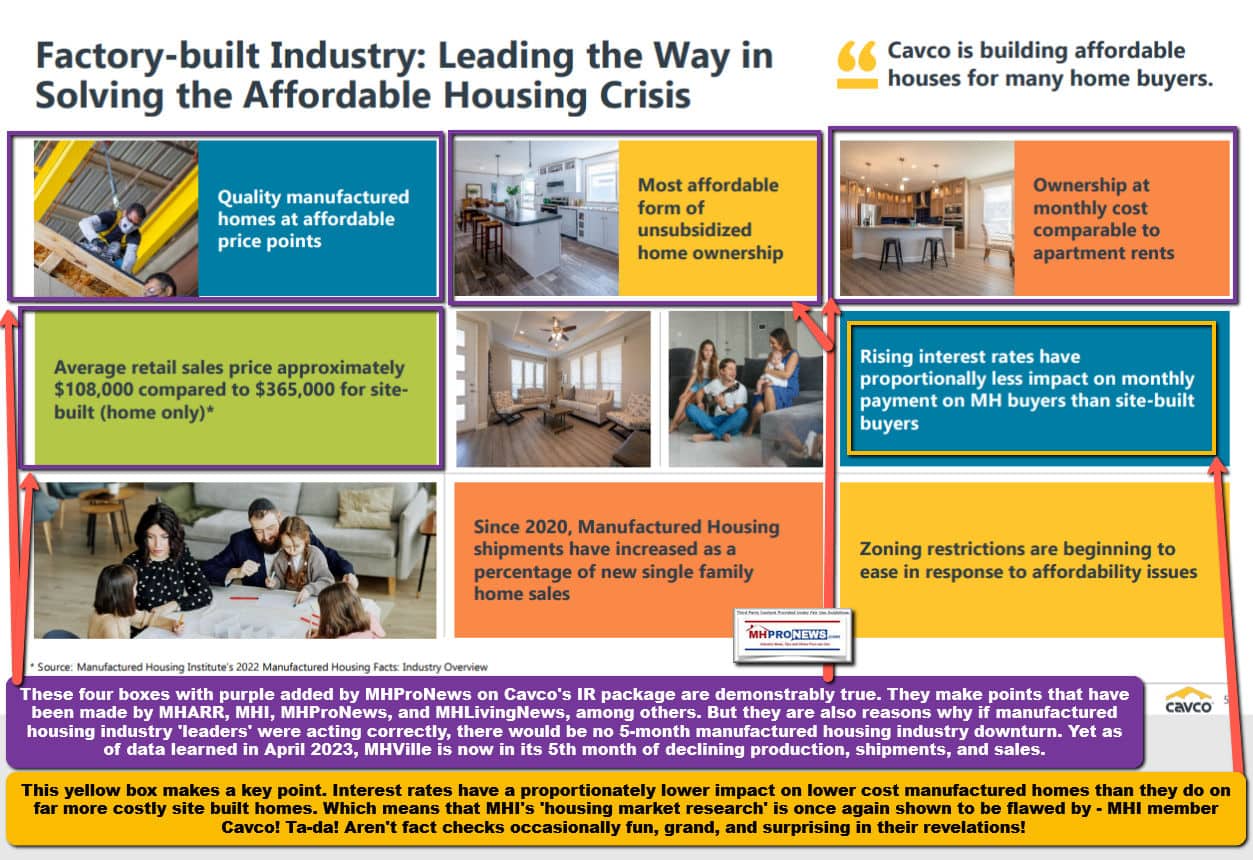
It isn’t just MHARR and MHProNews/MHLivingNews that is pressing MHI and their dominating brands on why the industry is underperforming during an affordable housing market. Analyst Gregory Palm pushed Cavco’s President and CEO William “Bill” Boor (who happens to be MHI’s vice chairman) on why manufactured housing is production is “so weak?” Check out that report below.
Pro-MHI linked trade media can’t spin hard enough, it seems, to get beyond the facts once the facts and the spin are lined up side-by-side.
Notice: the graphic below can be expanded to a larger size.
See the instructions below the graphic below or click the image and follow the prompts.

The facts with common sense analysis doesn’t lie, even though others apparently like to palter, spin or even fib.

The report from the Texas Manufactured Housing Association and the Texas Real Estate Research Center didn’t help out MHI’s narrative either.
MHI can talk about ‘elevating the industry’s profile’ but if they do so then what they are calling attention to for thinking people is that manufactured housing is once more dropping in sales and shipments while they claim to be ‘elevating’ the profile and “expanding” the industry’s products because they are ‘attainable.’ Who at MHI makes their drivel up?
Research and reports involving four different attorneys shed tremendous light on what’s gone wrong in HUD Code manufactured housing. Some directly or indirectly point their fingers at MHI and some of their leading brands.
What Bing Had to Say
In response to the following inquiry: Write a 1000 word article on why manufactured housing is underperforming during an affordable housing crisis here is how Bing replied.

The growing housing supply shortage is also a key contributor to the housing affordability crisis. Following the Great Recession, the share of homes being built fell significantly, causing buyer demand to exceed housing production. In fact, fewer new homes were built in the decade following the Great Recession than in any decade since the 1960s 3.
However, manufactured-housing developers are in a position to close local affordable housing gaps more quickly than traditional home builders. Planners often underestimate manufactured housing’s potential for alleviating affordable housing supply shortages 4.
I hope this helps.
Learn more:
That wasn’t even close to 1000 words, but Bing’s AI repeatedly referenced points, articles, and media releases that MHProNews and/or MHLivingNews have pointed to the facts that our industry-leading platforms have.
Senator Tim Scott (SC-R) is clearly open and favorable to manufactured housing issues. He, his team, and allies should push for new Congressional hearings on what has gone wrong with the Manufactured Housing Improvement Act of 2000 (MHIA), it’s enhanced preemption provision, and the Duty to Serve (DTS) manufactured housing. If has been about a dozen years since members of Congress held their Danville field hearings on the implementation of the MHIA, and there has been no apparent improvement since then. Let honest lawmakers and public officials explore these issues in a public and transparent fashion. Only be exposing the root causes of the lack of affordable housing can the obvious solutions be unchained for the benefit of millions of Americans of all backgrounds. ###



Again, our thanks to free email subscribers and all readers like you, as well as our tipsters/sources, sponsors and God for making and keeping us the runaway number one source for authentic “News through the lens of manufactured homes and factory-built housing” © where “We Provide, You Decide.” © ## (Affordable housing, manufactured homes, reports, fact-checks, analysis, and commentary. Third-party images or content are provided under fair use guidelines for media.) See Related Reports, further below. Text/image boxes often are hot-linked to other reports that can be access by clicking on them.)

By L.A. “Tony” Kovach – for MHProNews.com.
Tony earned a journalism scholarship and earned numerous awards in history and in manufactured housing.
For example, he earned the prestigious Lottinville Award in history from the University of Oklahoma, where he studied history and business management. He’s a managing member and co-founder of LifeStyle Factory Homes, LLC, the parent company to MHProNews, and MHLivingNews.com.
This article reflects the LLC’s and/or the writer’s position and may or may not reflect the views of sponsors or supporters.
Connect on LinkedIn: http://www.linkedin.com/in/latonykovach
Related References:
The text/image boxes below are linked to other reports, which can be accessed by clicking on them.’


