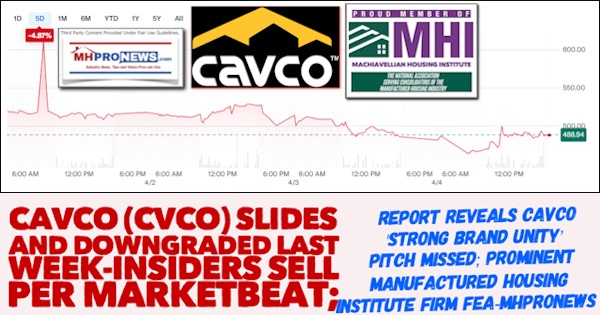
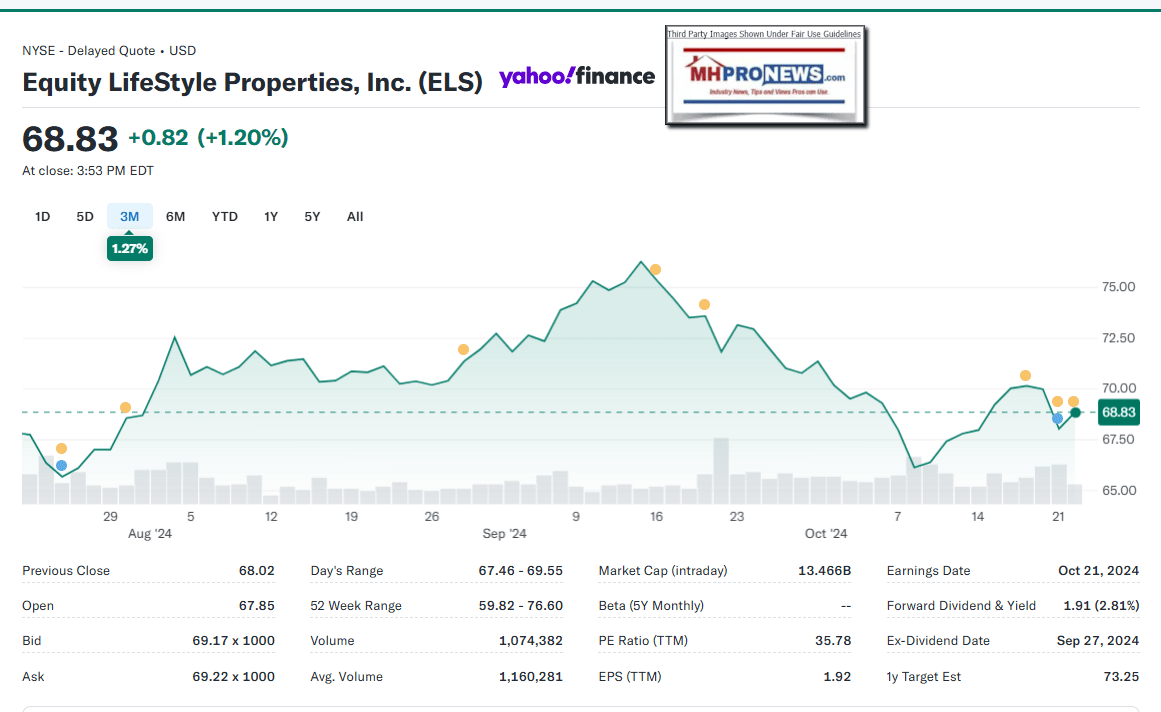
There is a valid concern that investors in Equity LifeStyle Properties (ELS) should have about that higher-profile Manufactured Housing Institute (MHI) member corporation’s investment thesis and business practices. Why? While ‘throttling’ is not uncommon among conventional site builders, they are nevertheless producing more housing at a plausible rate that is generally profit generating. But by contrast, ELS made their investment thesis a key page that boasts about stark limits on new development which they rationalize is somehow good for themselves and their investors, which based on information from an ELS competitor that is also an MHI member, fails the tests of evidence and common sense. If limiting developing is such a great plan, why do multifamily housing builders continue to construct properties at a rate several times that of the sales of new HUD Code manufactured homes? If limiting manufactured housing developing is so great, then why have MHI CEO Lesli Gooch go through the charade of lamenting new MHC developing? If ELS’s claim that limited new developing is such a great investment thesis, then why is it that in advance of this quarterly release of data that follows, three of ELS’ corporate insiders sold sizable blocks of stocks worth in total between those C-suite ELS leaders millions of dollars?
There are more questions that need to be asked and issues that need to be highlighted, which will be provided in Part II of the analysis portion of this report. Don’t miss bullets 5 and 6.
Part I is information from ELS’ corporate website. Their full information package for their third quarter results is linked here.
Part I
ELS CONTACT: Paul Seavey FOR IMMEDIATE RELEASE
(800) 247-5279 October 21, 2024
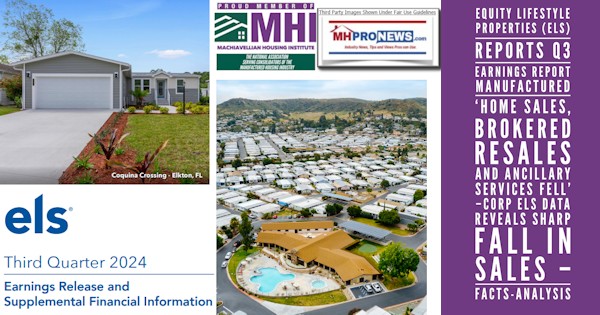
ELS REPORTS THIRD QUARTER RESULTS
Continued Strong Performance
Preliminary 2025 Rent Rate Growth Assumptions
CHICAGO, IL – October 21, 2024 – Equity LifeStyle Properties, Inc. (NYSE: ELS) (referred to herein as “we,” “us,” and “our”) today announced results for the quarter and nine months ended September 30, 2024. All per share results are reported on a fully diluted basis unless otherwise noted.
FINANCIAL RESULTS
| ($ in millions, except per share data) | Quarters Ended September 30, | |
| Net Income per Common Share
Funds from Operations (“FFO”) per Common Share and OP Unit Normalized Funds from Operations (“Normalized FFO”) per Common Share and OP Unit |
2024 2023 $ Change % Change (1) | |
| $
$ $ |
0.44 $ 0.41 $ 0.03 7.5 % 0.72 $ 0.68 $ 0.04 5.3 %
0.72 $ 0.68 $ 0.04 4.9 % Nine Months Ended September 30, |
|
| Net Income per Common Share
FFO per Common Share and OP Unit Normalized FFO per Common Share and OP Unit |
$
$ $ |
2024 2023 $ Change % Change (1)
1.45 $ 1.19 $ 0.26 21.8 % 2.27 $ 2.01 $ 0.26 12.8 % 2.16 $ 2.04 $ 0.12 5.6 % |
_____________________
- Calculations prepared using actual results without rounding.
Operations Update
Normalized FFO per Common Share and OP Unit for the quarter ended September 30, 2024 was $0.72, representing a 4.9% increase compared to the same period in 2023, performing at the midpoint of our guidance range of $0.72. Normalized FFO for the nine months ended September 30, 2024, was $2.16 per Common Share and OP Unit, representing a 5.6% increase compared to the same period in 2023. Core property operating revenues increased 4.4% and Core income from property operations, excluding property management increased 5.8% for the quarter ended September 30, 2024, compared to the same period in 2023. For the nine months ended September 30, 2024, Core property operating revenues increased 4.9% and Core income from property operations, excluding property management increased 6.2% compared to the same period in 2023.
MH
Core MH base rental income for the quarter ended September 30, 2024 increased 6.2% compared to the same period in 2023, which reflects 5.8% growth from rate increases and 0.4% from occupancy gains. Core MH homeowners increased by 111, and we sold 173 new homes during the quarter ended September 30, 2024. The average sales price of new homes sold was approximately $88,000. Core MH base rental income for the nine months ended September 30, 2024 increased 6.2% compared to the same period in 2023, which reflects 6.0% growth from rate increases and 0.2% from occupancy gains.
RV and Marina
Core RV and marina base rental income for the quarter ended September 30, 2024 increased 1.3% compared to the same period in 2023. Core RV and marina annual base rental income increased 6.2% for the quarter ended September 30, 2024, compared to the same period in 2023. Core RV and marina base rental income for the nine months ended September 30, 2024 increased 3.0% compared to the same period in 2023. Core RV and marina annual base rental income increased 6.9% for the nine months ended September 30, 2024, compared to the same period in 2023.
Property Operating Expenses
Core property operating expenses, excluding property management for the quarter ended September 30, 2024 increased 2.8% compared to the same period in 2023. For the nine months ended September 30, 2024, Core property operating expenses, excluding property management increased 3.4% compared to same period in 2023.
Balance Sheet Activity
In October 2024, we sold approximately 4.5 million shares of our common stock at a price of $70.00 from our at-the-market (“ATM”) offering program. The net proceeds of $314.2 million were used to repay our $300.0 million unsecured term loan (the “$300 million Term Loan”) and to terminate the interest rate swaps, which fixed the interest rate of the $300 million Term Loan at 6.05% until maturity in April 2026.
Storm Events
Following Hurricane Helene which made landfall on September 26, 2024 we accrued approximately $1.0 million of expenses related to debris removal and cleanup, which is reflected in Casualty-related charges/ (recoveries), net on the consolidated income statement, and we recorded a $1.8 million reduction to the carrying value of certain assets, which is included in Loss on sale of real estate and impairment, net in the Consolidated Statements of Income on page 3.
Following Hurricane Milton which made landfall on October 9, 2024, we have continued cleanup efforts at impacted properties. We believe that we have adequate insurance, subject to deductibles, including business interruption coverage, and at this time, we do not believe that Hurricane Milton will have a significant adverse impact on our results of operations or our financial condition on a consolidated basis.
Guidance Update (1)
Consistent with our historical practice at this time of year, we have updated and narrowed the full year guidance range. The full year guidance range of $0.06 per share is the same as the fourth quarter guidance range.
The updated guidance does not include assumptions related to debris removal and restoration costs, and possible business interruption losses, asset impairments or insurance recoveries related to Hurricane Milton. We believe we have adequate insurance coverage, subject to deductibles, for losses related to Hurricane Milton, but we are unable to predict the timing or amount of recovery. Furthermore, in accordance with GAAP, insurance reimbursement for business interruption losses is to be recognized as revenue only upon receipt.
| ($ in millions, except per share data) | 2024 | |
| Net Income per Common Share
FFO per Common Share and OP Unit Normalized FFO per Common Share and OP Unit |
2023 Actual | Fourth quarter Full Year
$0.44 to $0.50 $1.89 to $1.95 $0.70 to $0.76 $2.96 to $3.02 $0.73 to $0.79 $2.89 to $2.95 2024 Growth Rates |
Fourth
Core Portfolio: quarter Full Year Fourth quarter Full Year
| MH base rental income | $ | 170.1 | $ | 668.5 | 5.5% to 6.1% 5.8% to 6.4% |
| RV and marina base rental income (2) | $ | 96.0 | $ | 413.5 | 2.7% to 3.3% 2.7% to 3.3% |
| Property operating revenues
Property operating expenses, excluding property |
$ | 320.8 | $ | 1,297.7 | 4.2% to 4.8% 4.5% to 5.1% |
| management | $ | 133.0 | $ | 562.3 | 1.1% to 1.7% 2.6% to 3.2% |
| Income from property operations, excluding property management | $ | 187.8 | $ | 735.4 | 6.4% to 7.0% 6.0% to 6.6% |
| Non-Core Portfolio: | 2024 Full Year | ||||
| Income from property operations, excluding property management
Other Guidance Assumptions: Property management and general administrative Debt assumptions: Weighted average debt outstanding Interest and related amortization |
$13.9 to $17.9
2024 Full Year $113.6 to $119.6 $3,350 to $3,550 $135.4 to $141.4 |
Preliminary 2025 Rent Rate Growth Assumptions (1)
- By October month-end, we anticipate sending 2025 rent increase notices to approximately 50% of our MH residents. The average expected rate increase of these notices is approximately 5.0%.
- We have set RV annual rates for 2025 for more than 95% of our annual sites. The average rate increase for these annual sites is approximately 5.5%.
______________________
- Fourth quarter and full year 2024 guidance represent management’s estimate of a range of possible outcomes. The midpoint of the ranges and the preliminary 2025 rent rate growth assumptions reflect management’s estimate of the most likely outcome based on our current view of existing market conditions and assumptions. Actual results could vary materially from management’s estimates presented above if any of our assumptions, including occupancy and rate changes, our ability to manage expenses in an inflationary environment, our ability to integrate and operate recent acquisitions and costs to restore property operations and potential revenue losses following storms or other unplanned events, are incorrect. See Forward-Looking Statements in this press release for additional factors impacting our 2024 and 2025 guidance assumptions. See Non-GAAP Financial Measures Definitions and Reconciliations at the end of the supplemental financial information for definitions of FFO and Normalized FFO and a reconciliation of Net income per Common Share – Fully Diluted to FFO per Common Share and OP Unit – Fully Diluted and Normalized FFO per Common Share and OP Unit – Fully Diluted.
- Core RV and marina annual revenue represents approximately 77.8% and 70.4% of fourth quarter 2024 and full year 2024 RV and marina base rental income guidance, respectively. Core RV and marina annual revenue fourth quarter 2024 growth rate range is 5.8% to 6.4% and the full year 2024 growth rate range is 6.4% to 7.0%.
About Equity LifeStyle Properties
We are a self-administered, self-managed real estate investment trust (“REIT”) with headquarters in Chicago. As of October 21, 2024, we own or have an interest in 452 properties in 35 states and British Columbia consisting of 172,870 sites.
For additional information, please contact our Investor Relations Department at (800) 247-5279 or at investor_relations@equitylifestyle.com. …”
MHProNews Note: Skipping Ahead.
Home Sales and Rental Home Operations
(In thousands, except home sale volumes and occupied rentals, unaudited)
Quarters Ended Nine Months Ended
Home Sales – Select Data September 30, September 30,
| Total new home sales volume ……………………………………………………………….. | 174 285 | 620 687 | ||
| New home sales gross revenues …………………………………………………………….. | $ | 15,500 $ 27,684 | $ | 55,906 $ 69,036 |
| Total used home sales volume ……………………………………………………………….. | 60 84 | 173 252 | ||
| Used home sales gross revenues …………………………………………………………….. | $ | 883 $ 1,020 | $ | 2,961 $ 3,229 |
| Brokered home resales volume ………………………………………………………………. | 135 160 | 396 495 | ||
| Brokered home resales gross revenues ……………………………………………………. | $ | 551 $ 704 | $ | 1,772 $ 2,255 |
| Rental Homes – Select Data | Quarters Ended September 30, | Nine Months Ended September 30, | ||
| $
|
8,515
1,387 2,390 1,795 217 |
| 2,012 |
Rental operations revenues (1) …………………………………………………………………$ 9,406 $ 26,170 $ 29,491
Rental home operations expense (2) …………………………………………………………. 1,762 4,313 3,879
Depreciation on rental homes (3) …………………………………………………………….. 2,727 7,450 8,275
Occupied rentals: (4)
New ……………………………………………………………………………………………………. 2,086
Used …………………………………………………………………………………………………… 259
Total occupied rental sites ………………………………………………………………… 2,345
| As of September 30, 2024 | As of September 30, 2023 | ||
| Cost basis in rental homes: (5) | Net of
Gross Depreciation |
Net of
Gross Depreciation |
| $
|
249,568 12,606 |
| $ | 262,174 |
| $
|
220,134 11,197 |
| $ | 231,331 |
New …………………………………………………………………………………………………….$ 180,787 $ 218,955
Used ……………………………………………………………………………………………………. 6,972 8,906
Total rental homes ………………………………………………………………………………$ 187,759 $ 227,861
MHProNews Note: the balance of the ELS supplemental third quarter 2024 information is linked here. ##
Part II – Additional Information with More MHProNews Analysis and Commentary in Brief
1) Recapping the data from ELS above said this about their sales data, which they admit reflects a sharp drop. During an affordable housing crisis, this is one cautionary signal or ‘red flag.’
Home Sales – Select Data September 30, September 30,
| Total new home sales volume ……………………………………………………………….. | 174 285 | 620 687 | ||
| New home sales gross revenues …………………………………………………………….. | $ | 15,500 $ 27,684 | $ | 55,906 $ 69,036 |
| Total used home sales volume ……………………………………………………………….. | 60 84 | 173 252 | ||
| Used home sales gross revenues …………………………………………………………….. | $ | 883 $ 1,020 | $ | 2,961 $ 3,229 |
| Brokered home resales volume ………………………………………………………………. | 135 160 | 396 495 | ||
| Brokered home resales gross revenues ……………………………………………………. | $ | 551 $ 704 | $ | 1,772 $ 2,255 |
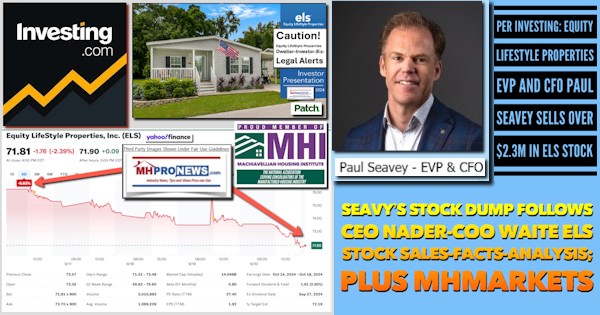
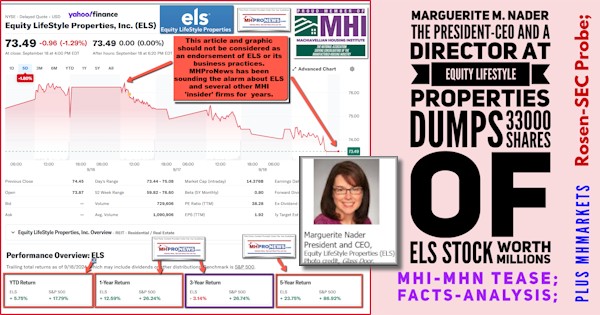
2) As noted in the preface above, the c-suite ELS’ insiders have collectively sold millions of dollars’ worth of stock.

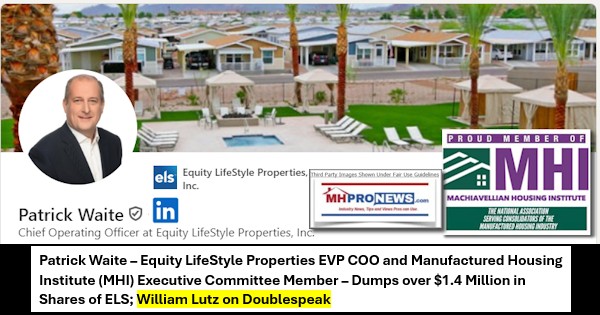
3) To the point of the apparent duplicity and doublespeak involving MHI, which as Patrick Waite as a prominent board member, see the related reports that follow.


4) While much of the industry’s other MHI-linked trade media and bloggers have downplayed or ignored the class action lawsuits involving ELS, ELS owned Datacomp, and other MHI members and/or firms who are often members of MHI-linked state associations.


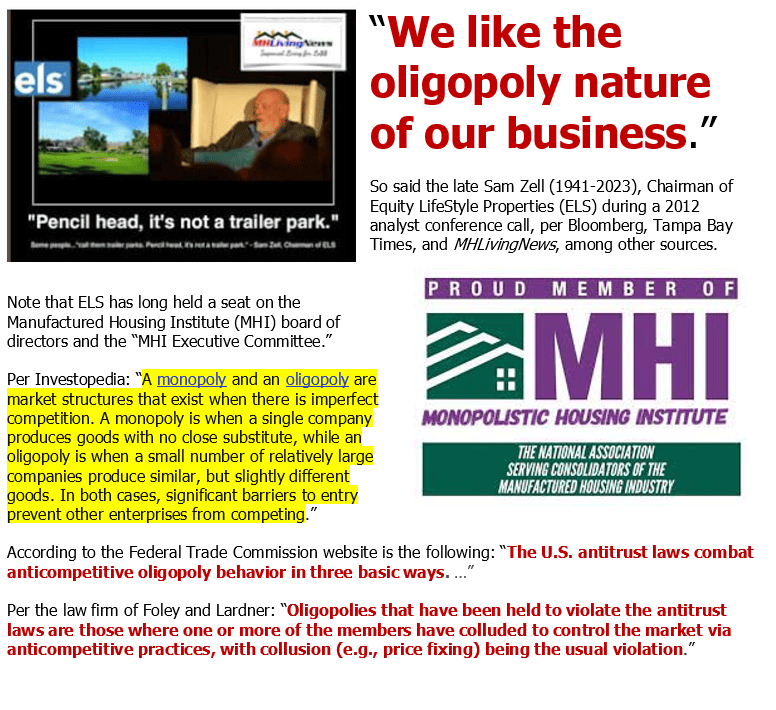
5) Let’s be clear. If MHI ‘insider brands’ – like ELS – didn’t think that what they were doing was questionable or wrong, then why bother having MHI’s CEO Lesli Gooch do an “interview” like the one below that postures something quite at variance with what ELS themselves have said in their own investor relations deck? The fact that MHI feels the need, or has been nudged to do such puff pieces may be construed as evidence of consciousness of guilt. Guilt of what? A potential range of legal and ethical concerns that includes ELS violating antitrust laws and is potentially failing their investors by following an investment thesis that is clearly harmful to the interests of their own customers in the long run, and thus harmful to the interests of the image and health of the manufactured home industry.


6) Manufactured housing sales are demonstrably underperforming during an affordable housing crisis. That ELS has suffered a sharp slide of sales, as was noted, is a cautionary tale if not a red flag for the firm and its investors. Manufactured home sales could be 5 to 10 times bigger than it is, just based on historic, market needs, and other evidence. See the linked reports above and below to learn more. Stay tuned for a planned follow up on ELS’ quarterly results planned in the days ahead. ###




Again, our thanks to free email subscribers and all readers like you, as well as our tipsters/sources, sponsors and God for making and keeping us the runaway number one source for authentic “News through the lens of manufactured homes and factory-built housing” © where “We Provide, You Decide.” © ## (Affordable housing, manufactured homes, reports, fact-checks, analysis, and commentary. Third-party images or content are provided under fair use guidelines for media.) See Related Reports, further below. Text/image boxes often are hot-linked to other reports that can be access by clicking on them.)

By L.A. “Tony” Kovach – for MHProNews.com.
Tony earned a journalism scholarship and earned numerous awards in history and in manufactured housing.
For example, he earned the prestigious Lottinville Award in history from the University of Oklahoma, where he studied history and business management. He’s a managing member and co-founder of LifeStyle Factory Homes, LLC, the parent company to MHProNews, and MHLivingNews.com.
This article reflects the LLC’s and/or the writer’s position and may or may not reflect the views of sponsors or supporters.
Connect on LinkedIn: http://www.linkedin.com/in/latonykovach
Related References:
The text/image boxes below are linked to other reports, which can be accessed by clicking on them.’


