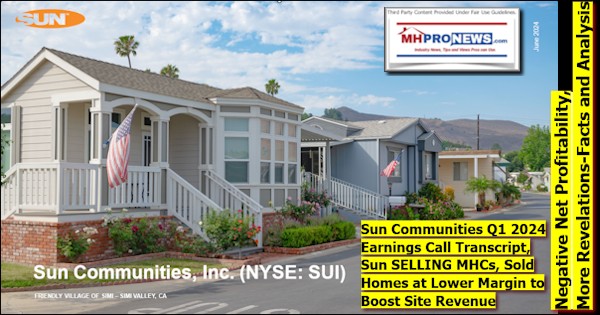
Equity LifeStyle Properties Second Quarter Results–Claims of ‘Strong Performance’ Examined via Lens of Potentially Mounting Legal-Reg Concerns as ELS Double Down on IR Statement; plus MHMarkets
“Core MH [i.e.: manufactured home] base rental income for the quarter ended June 30, 2024, increased 6.2% compared to the same period in 2023, which reflects 6.0% growth from rate increases and 0.2% from occupancy gains.” So said Equity LifeStyle Properties (ELS) as part of their second quarter of 2024 public disclosures. The firm described itself in their news release like this: “About Equity LifeStyle Properties | We are a self-administered, self-managed real estate investment trust (“REIT”) with headquarters in Chicago. As of July 22, 2024, we own or have an interest in 452 properties in 35 states and British Columbia consisting of 172,866 sites.” How many of those sites are intended for manufactured homes? Some pull quotes about the manufactured home site-count and occupancy levels, per ELS’ release, are below. What follows in Part I of today’s report provides the full context for the statements immediately below from ELS.
Total sites (5)
73,006
Occupied sites
68,928
Occupancy %
94.4 %
Monthly base rent per site
$ 854
To compare that 94.4% occupancy rate to conventional multifamily (i.e.: apartments) housing occupancy, consider this from Multi Housing News on 5.14.2024: “National occupancy remained at 94.5 percent in March, a rate held since the beginning of the year.” Yardi and other sources provided that same figure. Given that fact, ELS’ performance reported for the most recent quarter may look pretty good.
But as seasoned manufactured housing pros know, the move-out rate of manufactured homes is very low. Manufactured homes, once sited, rarely are moved again, for cost and other reasons. When some marketing insights from ELS found in Part II are presented, the question should be asked: why aren’t they at over 98% or 99% occupancy? Before someone objects to that notion, ELS itself said in a recent IR pitch: “50% of MH Communities are 98%+ Occupied.” Since it has been achieved in over half of their properties, and given the affordable housing crisis, why aren’t more or all of the MHC properties operating at that level?
There is a lot to consider, because there is a lot of details, which follow in Part I below. Part II will explore potential legal and regulatory concerns in the light of ELS’ statements and apparent behaviors.
Part I – Equity LifeStyle Properties (ELS) Press Release on Quarterly Results
ELS REPORTS SECOND QUARTER RESULTS
PR Newswire
Mon, Jul 22, 2024
Continued Strong Performance; Increases 2024 Earnings Guidance
CHICAGO, July 22, 2024 /PRNewswire/ — Equity LifeStyle Properties, Inc. (NYSE: ELS) (referred to herein as “we,” “us,” and “our”) today announced results for the quarter and six months ended June 30, 2024. All per share results are reported on a fully diluted basis unless otherwise noted.
FINANCIAL RESULTS
($ in millions, except per share data)
Quarter Ended June 30,
2024
2023
$ Change
% Change (1)
Net Income per Common Share
$ 0.42
$ 0.34
$ 0.08
24.3 %
Funds from Operations (“FFO”) per Common Share and OP Unit
$ 0.69
$ 0.61
$ 0.08
13.5 %
Normalized Funds from Operations (“Normalized FFO”) per Common Share and OP Unit
$ 0.66
$ 0.64
$ 0.02
2.9 %
Six Months Ended June 30,
2024
2023
$ Change
% Change (1)
Net Income per Common Share
$ 1.01
$ 0.78
$ 0.23
29.4 %
FFO per Common Share and OP Unit
$ 1.55
$ 1.33
$ 0.22
16.6 %
Normalized FFO per Common Share and OP Unit
$ 1.44
$ 1.36
$ 0.08
5.9 %
1. Calculations prepared using actual results without rounding.
Operations Update
Normalized FFO per Common Share and OP Unit for the quarter ended June 30, 2024 was $0.66, representing a 2.9% increase compared to the same period in 2023, outperforming the midpoint of our guidance range of $0.64. Normalized FFO for the six months ended June 30, 2024, was $1.44 per Common Share and OP Unit, representing a 5.9% increase compared to the same period in 2023. Core property operating revenues increased 4.6% and Core income from property operations, excluding property management increased 5.5% for the quarter ended June 30, 2024, compared to the same period in 2023. For the six months ended June 30, 2024, Core property operating revenues increased 5.2% and Core income from property operations, excluding property management increased 6.4% compared to the same period in 2023.
MH
Core MH base rental income for the quarter ended June 30, 2024 increased 6.2% compared to the same period in 2023, which reflects 6.0% growth from rate increases and 0.2% from occupancy gains. Core MH homeowners increased by 171, and we sold 255 new homes during the quarter ended June 30, 2024. The new homes sold had an average sales price of approximately $89,000. Core MH base rental income for the six months ended June 30, 2024 increased 6.3% compared to the same period in 2023, which reflects 6.1% growth from rate increases and 0.2% from occupancy gains.
RV and Marina
Core RV and marina base rental income for the quarter ended June 30, 2024 increased 2.0% compared to the same period in 2023. Core RV and marina annual base rental income increased 6.6% for the quarter ended June 30, 2024, compared to the same period in 2023. Core RV and marina base rental income for the six months ended June 30, 2024 increased 4.0% compared to the same period in 2023. Core RV and marina annual base rental income increased 7.3% for the six months ended June 30, 2024, compared to the same period in 2023.
Property Operating Expenses
Core property operating expenses, excluding property management for the quarter ended June 30, 2024 increased 3.4% compared to the same period in 2023. For the six months ended June 30, 2024, Core property operating expenses, excluding property management increased 3.7% compared to same period in 2023.
Balance Sheet Activity
On July 18, 2024, we closed on a modification of our $500 million unsecured line of credit to extend the maturity date to July 18, 2028 and add an option to extend the maturity date on our $300 million senior unsecured term loan to April 16, 2027. All other material terms, including interest rate terms, will remain the same.
Income from property operations, excluding property management
$ 182.9
$ 735.4
4.2% to 4.8%
5.4% to 6.4%
Non-Core Portfolio:
2024 Full Year
Income from property operations, excluding property management
$14.0 to $18.0
Other Guidance Assumptions:
2024 Full Year
Property management and general administrative
$113.2 to $119.2
Debt assumptions:
Weighted average debt outstanding
$3,400 to $3,600
Interest and related amortization
$140.6 to $146.6
1.
Third quarter and full year 2024 guidance represent management’s estimate of a range of possible outcomes. The midpoint of the ranges reflect management’s estimate of the most likely outcome based on our current view of existing market conditions and assumptions. Actual results could vary materially from management’s estimates presented above if any of our assumptions, including occupancy and rate changes, our ability to manage expenses in an inflationary environment, our ability to integrate and operate recent acquisitions and costs to restore property operations and potential revenue losses following storms or other unplanned events, are incorrect. See Forward-Looking Statements in this press release for additional factors impacting our 2024 guidance assumptions. See Non-GAAP Financial Measures Definitions and Reconciliations at the end of the supplemental financial information for definitions of FFO and Normalized FFO and a reconciliation of Net income per Common Share – Fully Diluted to FFO per Common Share and OP Unit – Fully Diluted and Normalized FFO per Common Share and OP Unit – Fully Diluted.
2.
Core RV and marina annual revenue represents approximately 67.4% and 69.9% of third quarter 2024 and full year 2024 RV and marina base rental income guidance, respectively. Core RV and marina annual revenue third quarter 2024 growth rate range is 6.3% to 6.9% and the full year 2024 growth rate range is 6.5% to 7.5%.
About Equity LifeStyle Properties
We are a self-administered, self-managed real estate investment trust (“REIT”) with headquarters in Chicago. As of July 22, 2024, we own or have an interest in 452 properties in 35 states and British Columbia consisting of 172,866 sites.
A live audio webcast of our conference call discussing these results will take place tomorrow, Tuesday, July 23, 2024, at 10:00 a.m. Central Time. Please visit the Investor Relations section at www.equitylifestyleproperties.com for the link. A replay of the webcast will be available for two weeks at this site.
Forward-Looking Statements
In addition to historical information, this press release includes certain “forward-looking statements” within the meaning of the Private Securities Litigation Reform Act of 1995. When used, words such as “anticipate,” “expect,” “believe,” “project,” “estimate,” “guidance,” “intend,” “may be” and “will be” and similar words or phrases, or the negative thereof, unless the context requires otherwise, are intended to identify forward-looking statements and may include, without limitation, information regarding our expectations, goals or intentions regarding the future, and the expected effect of our acquisitions. Forward-looking statements, including our guidance concerning Net Income, FFO and Normalized FFO per share data, and certain growth rates, by their nature, involve estimates, projections, goals, forecasts and assumptions and are subject to risks and uncertainties that could cause actual results or outcomes to differ materially from those expressed in a forward-looking statement due to a number of factors, which include, but are not limited to the following: (i) the mix of site usage within the portfolio; (ii) yield management on our short-term resort and marina sites; (iii) scheduled or implemented rate increases on community, resort and marina sites; (iv) scheduled or implemented rate increases in annual payments under membership subscriptions; (v) occupancy changes; (vi) our ability to attract and retain membership customers; (vii) change in customer demand regarding travel and outdoor vacation destinations; (viii) our ability to manage expenses in an inflationary environment; (ix) changes in debt service and interest rates; (x) our ability to integrate and operate recent acquisitions in accordance with our estimates; (xi) our ability to execute expansion/development opportunities in the face of supply chain delays/shortages; (xii) completion of pending transactions in their entirety and on assumed schedule; (xiii) our ability to attract and retain property employees, particularly seasonal employees; (xiv) ongoing legal matters and related fees; (xv) costs to restore property operations and potential revenue losses following storms or other unplanned events; and (xvi) the potential impact of, and our ability to remediate, material weaknesses in our internal control over financial reporting. For further information on these and other factors that could impact us and the statements contained herein, refer to our filings with the Securities and Exchange Commission, including the “Risk Factors” and “Forward-Looking Statements” sections in our most recent Annual Report on Form 10-K and any subsequent Quarterly Reports on Form 10-Q. These forward-looking statements are based on management’s present expectations and beliefs about future events. As with any projection or forecast, these statements are inherently susceptible to uncertainty and changes in circumstances. We are under no obligation to, and expressly disclaim any obligation to, update or alter our forward-looking statements whether as a result of such changes, new information, subsequent events or otherwise.
Supplemental Financial Information
Financial Highlights (1)(2)
(In millions, except Common Shares and OP Units outstanding and per share data, unaudited)
As of and for the Quarters Ended
June 30,
2024
Mar 31,
2024
Dec 31,
2023
Sep 30,
2023
Jun 30,
2023
Operating Information
Total revenues
$ 380.0
$ 386.6
$ 360.6
$ 388.8
$ 370.0
Consolidated net income
$ 82.1
$ 115.3
$ 96.4
$ 80.7
$ 66.0
Net income available for Common Stockholders
$ 78.3
$ 109.9
$ 91.9
$ 77.0
$ 62.9
Adjusted EBITDAre
$ 164.3
$ 186.3
$ 171.1
$ 167.0
$ 157.7
FFO available for Common Stock and OP Unit holders
$ 134.7
$ 167.4
$ 148.5
$ 133.8
$ 118.6
Normalized FFO available for Common Stock and OP Unit holders
$ 128.5
$ 152.7
$ 138.2
$ 133.9
$ 124.9
Funds Available for Distribution (“FAD”) for Common Stock and OP Unit holders
$ 108.3
$ 136.9
$ 109.2
$ 107.8
$ 98.3
Common Shares and OP Units Outstanding (In thousands) and Per Share Data
Common Shares and OP Units, end of the period
195,621
195,598
195,531
195,525
195,514
Weighted average Common Shares and OP Units outstanding – Fully Diluted
195,465
195,545
195,475
195,440
195,430
Net income per Common Share – Fully Diluted (3)
$ 0.42
$ 0.59
$ 0.49
$ 0.41
$ 0.34
FFO per Common Share and OP Unit – Fully Diluted
$ 0.69
$ 0.86
$ 0.76
$ 0.68
$ 0.61
Normalized FFO per Common Share and OP Unit – Fully Diluted
$ 0.66
$ 0.78
$ 0.71
$ 0.68
$ 0.64
Dividends per Common Share
$ 0.4775
$ 0.4775
$ 0.4475
$ 0.4475
$ 0.4475
Balance Sheet
Total assets
$ 5,645
$ 5,630
$ 5,614
$ 5,626
$ 5,586
Total liabilities
$ 4,135
$ 4,110
$ 4,115
$ 4,129
$ 4,083
Market Capitalization
Total debt (4)
$ 3,499
$ 3,507
$ 3,548
$ 3,533
$ 3,479
Total market capitalization (5)
$ 16,240
$ 16,104
$ 17,341
$ 15,990
$ 16,557
Ratios
Total debt / total market capitalization
21.5 %
21.8 %
20.5 %
22.1 %
21.0 %
Total debt / Adjusted EBITDAre (6)
5.1
5.1
5.3
5.4
5.4
Interest coverage (7)
5.1
5.2
5.2
5.3
5.4
Fixed charges (8)
5.1
5.1
5.1
5.1
5.2
1.
See Non-GAAP Financial Measures Definitions and Reconciliations at the end of the supplemental financial information for definitions of Adjusted EBITDAre, FFO, Normalized FFO and FAD and a reconciliation of Consolidated net income to Adjusted EBITDAre.
2.
See page 6 for a reconciliation of Net income available for Common Stockholders to Non-GAAP financial measures FFO available for Common Stock and OP Unit holders, Normalized FFO available for Common Stock and OP Unit holders and FAD for Common Stock and OP Unit holders.
3.
Net income per Common Share – Fully Diluted is calculated before Income allocated to non-controlling interest – Common OP Units.
4.
Excludes deferred financing costs of approximately $27.8 million as of June 30, 2024.
5.
See page 14 for the calculation of market capitalization as of June 30, 2024.
6.
Calculated using trailing twelve months Adjusted EBITDAre.
7.
Calculated by dividing trailing twelve months Adjusted EBITDAre by the interest expense incurred during the same period.
8.
See Non-GAAP Financial Measures Definitions and Reconciliations at the end of the supplemental financial information for a definition of fixed charges. This ratio is calculated by dividing trailing twelve months Adjusted EBITDAre by the sum of fixed charges and preferred stock dividends, if any, during the same period.
Consolidated Balance Sheets
(In thousands, except share and per share data)
June 30, 2024
December 31, 2023
(unaudited)
Assets
Investment in real estate:
Land
$ 2,088,682
$ 2,088,657
Land improvements
4,490,978
4,380,649
Buildings and other depreciable property
1,225,474
1,236,985
7,805,134
7,706,291
Accumulated depreciation
(2,544,276)
(2,448,876)
Net investment in real estate
5,260,858
5,257,415
Cash and restricted cash
35,658
29,937
Notes receivable, net
51,504
49,937
Investment in unconsolidated joint ventures
86,439
85,304
Deferred commission expense
54,882
53,641
Other assets, net
156,134
137,499
Total Assets
$ 5,645,475
$ 5,613,733
Liabilities and Equity
Liabilities:
Mortgage notes payable, net
$ 2,959,443
$ 2,989,959
Term loans, net
498,007
497,648
Unsecured line of credit
14,000
31,000
Accounts payable and other liabilities
177,819
151,567
Deferred membership revenue
228,099
218,337
Accrued interest payable
11,978
12,657
Rents and other customer payments received in advance and security deposits
152,433
126,451
Distributions payable
93,402
87,493
Total Liabilities
4,135,181
4,115,112
Equity:
Preferred stock, $0.01 par value, 10,000,000 shares authorized as of June 30, 2024 and December 31, 2023; none issued and outstanding
—
—
Common stock, $0.01 par value, 600,000,000 shares authorized as of June 30, 2024 and December 31, 2023; 186,516,405 and 186,426,281 shares issued and outstanding as of June 30, 2024 and December 31, 2023, respectively
1,917
1,917
Paid-in capital
1,646,160
1,644,319
Distributions in excess of accumulated earnings
(213,486)
(223,576)
Accumulated other comprehensive income
5,292
6,061
Total Stockholders’ Equity
1,439,883
1,428,721
Non-controlling interests – Common OP Units
70,411
69,900
Total Equity
1,510,294
1,498,621
Total Liabilities and Equity
$ 5,645,475
$ 5,613,733
Consolidated Statements of Income
(In thousands, unaudited)
Quarters Ended June 30,
Six Months Ended June 30,
2024
2023
2024
2023
Revenues:
Rental income
$ 300,788
$ 288,655
$ 617,386
$ 585,106
Annual membership subscriptions
16,369
16,189
32,584
32,159
Membership upgrade sales (1)
4,050
3,614
7,997
7,119
Other income
16,197
17,911
31,746
35,625
Gross revenues from home sales, brokered resales and ancillary services
37,565
38,913
67,618
71,046
Interest income
2,420
2,259
4,588
4,347
Income from other investments, net
2,630
2,473
4,668
4,564
Total revenues
380,019
370,014
766,587
739,966
Expenses:
Property operating and maintenance
126,105
122,214
240,888
234,697
Real estate taxes
20,099
18,832
40,886
37,148
Membership sales and marketing (2)
6,126
5,521
11,423
10,359
Property management
19,436
19,359
39,146
38,823
Depreciation and amortization
51,344
51,464
102,452
101,966
Cost of home sales, brokered resales and ancillary services
27,650
29,268
49,617
52,409
Home selling expenses and ancillary operating expenses
7,472
7,170
13,619
…
14,094
General and administrative
8,985
16,607
20,974
28,268
Casualty-related charges/(recoveries), net (3)
(6,170)
—
(21,013)
—
Other expenses
1,387
1,381
2,718
2,849
Interest and related amortization
36,037
33,122
69,580
65,710
Total expenses
298,471
304,938
570,290
586,323
Income before income taxes and other items
81,548
65,076
196,297
153,643
Gain/(Loss) on sale of real estate and impairment, net
—
—
—
(2,632)
Income tax benefit
—
—
239
—
Equity in income of unconsolidated joint ventures
579
973
862
1,497
Consolidated net income
82,127
66,049
197,398
152,508
Income allocated to non-controlling interests – Common OP Units
(3,822)
(3,121)
(9,188)
(7,209)
Redeemable perpetual preferred stock dividends
(8)
(8)
(8)
(8)
Net income available for Common Stockholders
$ 78,297
$ 62,920
$ 188,202
$ 145,291
1.
Membership upgrade sales revenue is net of deferrals of $4.7 million and $5.7 million for the quarters ended June 30, 2024 and June 30, 2023, respectively. See page 13 for details of membership sales activity.
2.
Membership sales and marketing expense is net of sales commission deferrals of $0.9 million for both quarters ended June 30, 2024 and June 30, 2023. See page 13 for details of membership sales activity.
3.
Casualty-related charges/(recoveries), net for the quarter ended June 30, 2024 includes debris removal and cleanup costs related to Hurricane Ian of $0.7 million and insurance recovery revenue of $6.9 million including $6.2 million for reimbursement of capital expenditures related to Hurricane Ian. Casualty-related charges/(recoveries), net for the six months ended June 30, 2024 includes debris removal and cleanup costs related to Hurricane Ian of $1.2 million and insurance recovery revenue of $22.3 million including $21.0 million for reimbursement of capital expenditures related to Hurricane Ian.
Non-GAAP Financial Measures
This document contains certain Non-GAAP measures used by management that we believe are helpful to understand our business. We believe investors should review these Non-GAAP measures along with GAAP net income and cash flows from operating activities, investing activities and financing activities, when evaluating an equity REIT’s operating performance. Our definitions and calculations of these Non-GAAP financial and operating measures and other terms may differ from the definitions and methodologies used by other REITs and, accordingly, may not be comparable. These Non-GAAP financial and operating measures do not represent cash generated from operating activities in accordance with GAAP, nor do they represent cash available to pay distributions and should not be considered as an alternative to net income, determined in accordance with GAAP, as an indication of our financial performance, or to cash flows from operating activities, determined in accordance with GAAP, as a measure of our liquidity, nor are they indicative of funds available to fund our cash needs, including our ability to make cash distributions. For definitions and reconciliations of Non-GAAP measures to our financial statements as prepared under GAAP, refer to both Reconciliation of Net Income to Non-GAAP Financial Measures on page 6 and Non-GAAP Financial Measures Definitions and Reconciliations on pages 16-19.
Selected Non-GAAP Financial Measures (1)
(In millions, except per share data, unaudited)
Quarter Ended
June 30, 2024
Income from property operations, excluding property management – Core (2)
$ 181.8
Income from property operations, excluding property management – Non-Core (2)
3.3
Property management and general and administrative
(28.4)
Other income and expenses
7.8
Interest and related amortization
(36.0)
Normalized FFO available for Common Stock and OP Unit holders (3)
$ 128.5
Insurance proceeds due to catastrophic weather event (4)
6.2
FFO available for Common Stock and OP Unit holders
$ 134.7
FFO per Common Share and OP Unit
$ 0.69
Normalized FFO per Common Share and OP Unit
$ 0.66
Normalized FFO available for Common Stock and OP Unit holders
$ 128.5
Non-revenue producing improvements to real estate
(20.2)
FAD for Common Stock and OP Unit holders
$ 108.3
Weighted average Common Shares and OP Units – Fully Diluted
195.5
1.
See page 6 for a reconciliation of Net income available for Common Stockholders to FFO available for Common Stock and OP Unit holders, Normalized FFO available for Common Stock and OP Unit holders and FAD for Common Stock and OP Unit holders.
2.
See pages 8-9 for details of the Core Income from Property Operations, excluding property management. See page 10 for details of the Non-Core Income from Property Operations, excluding property management.
3.
Amounts may not foot due to rounding.
4.
Represents insurance recovery revenue for reimbursement of capital expenditures related to Hurricane Ian.
Reconciliation of Net Income to Non-GAAP Financial Measures
(In thousands, except per share data, unaudited)
Quarters Ended June 30,
Six Months Ended June 30,
2024
2023
2024
2023
Net income available for Common Stockholders
$ 78,297
$ 62,920
$ 188,202
$ 145,291
Income allocated to non-controlling interests – Common OP Units
3,822
3,121
9,188
7,209
Depreciation and amortization
51,344
51,464
102,452
101,966
Depreciation on unconsolidated joint ventures
1,200
1,081
2,251
2,216
(Gain)/Loss on unconsolidated joint ventures
—
—
—
(416)
(Gain)/Loss on sale of real estate and impairment, net
—
—
—
2,632
FFO available for Common Stock and OP Unit holders
134,663
118,586
302,093
258,898
Deferred income tax benefit
—
—
(239)
—
Accelerated vesting of stock-based compensation expense
—
6,320
—
6,320
Transaction/pursuit costs and other (1)
—
—
383
207
Insurance proceeds due to catastrophic weather event (2)
(6,170)
—
(21,013)
—
Normalized FFO available for Common Stock and OP Unit holders
128,493
124,906
281,224
265,425
Non-revenue producing improvements to real estate
(20,220)
(26,573)
(36,042)
(44,685)
FAD for Common Stock and OP Unit holders
$ 108,273
$ 98,333
$ 245,182
$ 220,740
Net income per Common Share – Basic
$ 0.42
$ 0.34
$ 1.01
$ 0.78
Net income per Common Share – Fully Diluted (3)
$ 0.42
$ 0.34
$ 1.01
$ 0.78
FFO per Common Share and OP Unit – Basic
$ 0.69
$ 0.61
$ 1.55
$ 1.33
FFO per Common Share and OP Unit – Fully Diluted
$ 0.69
$ 0.61
$ 1.55
$ 1.33
Normalized FFO per Common Share and OP Unit – Basic
$ 0.66
$ 0.64
$ 1.44
$ 1.36
Normalized FFO per Common Share and OP Unit – Fully Diluted
$ 0.66
$ 0.64
$ 1.44
$ 1.36
Weighted average Common Shares outstanding – Basic
186,318
186,023
186,303
185,962
Weighted average Common Shares and OP Units outstanding – Basic
195,423
195,263
195,408
195,213
Weighted average Common Shares and OP Units outstanding – Fully Diluted
195,465
195,430
195,505
195,388
1.
Prior period amounts have been reclassified to conform to the current period presentation.
2.
Represents insurance recovery revenue for reimbursement of capital expenditures related to Hurricane Ian.
3.
Net income per Common Share – Fully Diluted is calculated before Income allocated to non-controlling interest – Common OP Units.
Consolidated Income from Property Operations (1)
(In millions, except home site and occupancy figures, unaudited)
Quarters Ended June 30,
Six Months Ended June 30,
2024
2023
2024
2023
MH base rental income(2)
$ 176.7
$ 166.4
$ 351.8
$ 331.0
Rental home income (2)
3.4
3.7
6.9
7.6
RV and marina base rental income (2)
103.4
101.9
223.5
213.5
Annual membership subscriptions
16.4
16.2
32.6
32.1
Membership upgrade sales (3)
4.1
3.6
8.0
7.1
Utility and other income (2)(4)
34.6
35.9
69.5
71.2
Property operating revenues
338.6
327.7
692.3
662.5
Property operating, maintenance and real estate taxes (2)
Income from property operations, excluding property management (1)
$ 185.1
$ 179.8
$ 396.5
$ 377.8
Manufactured home site figures and occupancy averages:
Total sites (5)
73,006
72,729
73,007
72,723
Occupied sites
68,928
68,792
68,922
68,820
Occupancy %
94.4 %
94.6 %
94.4 %
94.6 %
Monthly base rent per site
$ 854
$ 806
$ 851
$ 802
RV and marina base rental income:
Annual
$ 76.6
$ 72.7
$ 152.0
$ 142.1
Seasonal
8.0
9.5
37.5
37.4
Transient
18.8
19.7
34.0
34.0
Total RV and marina base rental income
$ 103.4
$ 101.9
$ 223.5
$ 213.5
1.
Excludes property management expenses.
2.
MH base rental income, Rental home income, RV and marina base rental income and Utility income, net of bad debt expense, are presented in Rental income in the Consolidated Statements of Income on page 3. Bad debt expense is presented in Property operating, maintenance and real estate taxes in this table.
3.
See page 13 for details of membership sales activity.
4.
Includes approximately $1.9 million and $4.0 million of business interruption income from Hurricane Ian during the quarters ended June 30, 2024 and June 30, 2023, respectively and $3.8 million and $8.0 million for the six months ended June 30, 2024 and June 30, 2023, respectively.
5.
For June 30, 2024, includes 293 MH expansion sites added during the quarter ended December 31, 2023.
Core Income from Property Operations (1)
(In millions, except occupancy figures, unaudited)
Income from property operations, excluding property management (1)
$ 3.3
$ 8.5
1.
Excludes property management expenses.
2.
Includes bad debt expense for the periods presented.
Home Sales and Rental Home Operations
(In thousands, except home sale volumes and occupied rentals, unaudited)
Home Sales – Select Data
Quarters Ended June 30,
Six Months Ended June 30,
2024
2023
2024
2023
Total new home sales volume
255
226
446
402
New home sales gross revenues
$ 22,706
$ 23,038
$ 40,406
$ 41,352
Total used home sales volume
59
66
113
168
Used home sales gross revenues
$ 1,240
$ 1,034
$ 2,078
$ 2,209
Brokered home resales volume
152
201
261
335
Brokered home resales gross revenues
$ 649
$ 876
$ 1,221
$ 1,551
Rental Homes – Select Data
Quarters Ended June 30,
Six Months Ended June 30,
2024
2023
2024
2023
Rental operations revenues (1)
$ 8,597
$ 9,827
$ 17,655
$ 20,085
Rental home operations expense (2)
1,557
1,158
2,926
2,117
Depreciation on rental homes (3)
2,492
2,802
5,060
5,549
Occupied rentals: (4)
New
1,790
2,236
Used
226
292
Total occupied rental sites
2,016
2,528
As of June 30, 2024
As of June 30, 2023
Cost basis in rental homes: (5)
Gross
Net of
Depreciation
Gross
Net of
Depreciation
New
$ 227,569
$ 187,382
$ 257,978
$ 226,759
Used
11,521
7,124
13,491
9,616
Total rental homes
$ 239,090
$ 194,506
$ 271,469
$ 236,375
1.
For the quarters ended June 30, 2024 and 2023, approximately $5.2 million and $6.1 million, respectively, of the rental operations revenue is included in the MH base rental income in the Core Income from Property Operations on pages 8-9. The remainder of the rental operations revenue for the quarters ended June 30, 2024 and 2023 is included in Rental home income in the Core Income from Property Operations on pages 8-9.
2.
Rental home operations expense is included in Property operating, maintenance and real estate taxes in the Consolidated Income from Property Operations on page 7. Rental home operations expense is included in Insurance and other in the Core Income from Property Operations on pages 8-9.
3.
Depreciation on rental homes in our Core portfolio is presented in Depreciation and amortization in the Consolidated Statements of Income on page 3.
4.
Includes occupied rental sites as of the end of the period in our Core portfolio.
5.
Includes both occupied and unoccupied rental homes in our Core portfolio.
Total Sites
(Unaudited)
Summary of Total Sites as of June 30, 2024
Sites (1)
MH sites
73,000
RV sites:
Annual
34,500
Seasonal
11,800
Transient
16,900
Marina slips
6,900
Membership (2)
26,000
Joint Ventures (3)
3,800
Total
172,900
1.
MH sites are generally leased on an annual basis to residents who own or lease factory-built homes, including manufactured homes. Annual RV and marina sites are leased on an annual basis to customers who generally have an RV, factory-built cottage, boat or other unit placed on the site, including those Northern properties that are open for the summer season. Seasonal RV and marina sites are leased to customers generally for one to six months. Transient RV and marina sites are leased to customers on a short-term basis.
2.
Sites primarily utilized by approximately 117,100 members. Includes approximately 5,900 sites rented on an annual basis.
3.
Joint ventures have approximately 2,000 annual sites and 1,800 transient sites.
Membership Campgrounds – Select Data
Years Ended December 31,
Six Months
Ended June 30,
Campground and Membership Revenue
($ in thousands, unaudited)
2020
2021
2022
2023
2024
Annual membership subscriptions
$ 53,085
$ 58,251
$ 63,215
$ 65,379
$ 32,584
Annual RV base rental income
$ 20,761
$ 23,127
$ 25,945
$ 27,842
$ 14,336
Seasonal/Transient RV base rental income
$ 18,126
$ 25,562
$ 24,316
$ 20,996
$ 8,893
Membership upgrade sales
$ 9,677
$ 11,191
$ 12,958
$ 14,719
$ 7,997
Utility and other income
$ 2,426
$ 2,735
$ 2,626
$ 2,544
$ 993
Membership Count
Total Memberships (1)
116,169
125,149
128,439
121,002
117,115
Paid Membership Origination
20,587
23,923
23,237
20,758
10,524
Promotional Membership Origination
23,542
26,600
28,178
25,232
12,283
Membership Upgrade Sales Volume (2)
3,373
4,863
4,068
3,858
1,776
Campground Metrics
Membership Campground Count
81
81
82
82
82
Membership Campground RV Site Count
24,800
25,100
25,800
26,000
26,000
Annual Site Count (3)
5,986
6,320
6,390
6,154
5,891
Membership Sales Activity
($ in thousands, unaudited)
Quarters Ended June 30,
2024
2023
Membership upgrade sales current period, gross
$ 8,785
$ 9,278
Membership upgrade sales upfront payments, deferred, net
(4,735)
(5,664)
Membership upgrade sales
$ 4,050
$ 3,614
Membership sales and marketing, gross
$ (6,979)
$ (6,392)
Membership sales commissions, deferred, net
853
871
Membership sales and marketing
$ (6,126)
$ (5,521)
1.
Members who have entered into annual subscriptions with us that entitle them to use certain properties on a continuous basis for up to 21 days.
2.
Existing members who have upgraded memberships are eligible for enhanced benefits, including but not limited to longer stays, the ability to make earlier reservations, potential discounts on rental units, and potential access to additional properties. Upgrades require a non-refundable upfront payment.
3.
Sites that have been rented by members for an entire year.
Market Capitalization
(In millions, except share and OP Unit data, unaudited)
Capital Structure as of June 30, 2024
Total
Common
Shares/Units
% of Total
Common
Shares/Units
Total
% of Total
% of Total
Market
Capitalization
Secured Debt
$ 2,985
85.3 %
Unsecured Debt
514
14.7 %
Total Debt (1)
$ 3,499
100.0 %
21.5 %
Common Shares
186,516,405
95.3 %
OP Units
9,104,654
4.7 %
Total Common Shares and OP Units
195,621,059
100.0 %
Common Stock price at June 30, 2024
$ 65.13
Fair Value of Common Shares and OP Units
$ 12,741
100.0 %
Total Equity
$ 12,741
100.0 %
78.5 %
Total Market Capitalization
$ 16,240
100.0 %
1.
Excludes deferred financing costs of approximately $27.8 million.
Debt Maturity Schedule
Debt Maturity Schedule as of June 30, 2024
(In thousands, unaudited)
Year
Outstanding
Debt
Weighted
Average
Interest Rate
% of Total
Debt
Weighted
Average
Years to
Maturity
Secured Debt
2024
$ —
— %
— %
—
2025
89,056
3.45 %
2.55 %
0.77
2026
—
— %
— %
—
2027
—
— %
— %
—
2028
199,098
4.19 %
5.69 %
4.20
2029
272,049
4.92 %
7.77 %
5.18
2030
275,385
2.69 %
7.87 %
5.75
2031
246,576
2.46 %
7.05 %
6.89
2032
202,000
2.47 %
5.77 %
8.21
2033
345,019
4.83 %
9.86 %
9.31
Thereafter
1,356,053
3.88 %
38.75 %
13.43
Total
$ 2,985,236
3.77 %
85.31 %
9.59
Unsecured Term Loans
2024
$ —
— %
— %
—
2025
—
— %
— %
—
2026
300,000
6.05 %
8.57 %
1.82
2027
200,000
4.88 %
5.72 %
2.60
2028
—
— %
— %
—
Thereafter
—
— %
— %
—
Total
$ 500,000
5.58 %
14.29 %
2.13
Total Secured and Unsecured
$ 3,485,236
4.03 %
99.60 %
8.50
Line of Credit Borrowing (1)
14,000
6.65 %
0.40 %
—
Note Premiums and Unamortized loan costs
(27,786)
Total Debt, Net
$ 3,471,449
4.21% (2)
100 %
1.
The floating interest rate on the line of credit is SOFR plus 0.10% plus 1.25% to 1.65%. During the quarter ended June 30, 2024, the effective interest rate on the line of credit borrowings was 6.65%.
2.
Reflects effective interest rate for the quarter ended June 30, 2024, including interest associated with the line of credit and amortization of deferred financing costs.
Non-GAAP Financial Measures Definitions and Reconciliations
The following Non-GAAP financial measures definitions have been revised and do not include adjustments in respect to membership upgrade sales: (i) FFO; (ii) Normalized FFO; (iii) EBITDAre; (iv) Adjusted EBITDAre; (v) Property operating revenues; (vi) Property operating expenses, excluding property management; and (vii) Income from property operations, excluding property management. For comparability, prior periods’ non-GAAP financial measures have also been updated.
FUNDS FROM OPERATIONS (FFO). We define FFO as net income, computed in accordance with GAAP, excluding gains or losses from sales of properties, depreciation and amortization related to real estate, impairment charges and adjustments to reflect our share of FFO of unconsolidated joint ventures. Adjustments for unconsolidated joint ventures are calculated to reflect FFO on the same basis. We compute FFO in accordance with our interpretation of standards established by the National Association of Real Estate Investment Trusts (“NAREIT”), which may not be comparable to FFO reported by other REITs that do not define the term in accordance with the current NAREIT definition or that interpret the current NAREIT definition differently than we do.
We believe FFO, as defined by the Board of Governors of NAREIT, is generally a measure of performance for an equity REIT. While FFO is a relevant and widely used measure of operating performance for equity REITs, it does not represent cash flow from operations or net income as defined by GAAP, and it should not be considered as an alternative to these indicators in evaluating liquidity or operating performance.
NORMALIZED FUNDS FROM OPERATIONS (NORMALIZED FFO). We define Normalized FFO as FFO excluding non-operating income and expense items, such as gains and losses from early debt extinguishment, including prepayment penalties, defeasance costs, transaction/pursuit costs and other, and other miscellaneous non-comparable items. Normalized FFO presented herein is not necessarily comparable to Normalized FFO presented by other real estate companies due to the fact that not all real estate companies use the same methodology for computing this amount.
FUNDS AVAILABLE FOR DISTRIBUTION (FAD). We define FAD as Normalized FFO less non-revenue producing capital expenditures.
We believe that FFO, Normalized FFO and FAD are helpful to investors as supplemental measures of the performance of an equity REIT. We believe that by excluding the effect of gains or losses from sales of properties, depreciation and amortization related to real estate and impairment charges, which are based on historical costs and may be of limited relevance in evaluating current performance, FFO can facilitate comparisons of operating performance between periods and among other equity REITs. We further believe that Normalized FFO provides useful information to investors, analysts and our management because it allows them to compare our operating performance to the operating performance of other real estate companies and between periods on a consistent basis without having to account for differences not related to our normal operations. For example, we believe that excluding the early extinguishment of debt and other miscellaneous non-comparable items from FFO allows investors, analysts and our management to assess the sustainability of operating performance in future periods because these costs do not affect the future operations of the properties. In some cases, we provide information about identified non-cash components of FFO and Normalized FFO because it allows investors, analysts and our management to assess the impact of those items.
INCOME FROM PROPERTY OPERATIONS, EXCLUDING PROPERTY MANAGEMENT. We define Income from property operations, excluding property management as rental income, membership subscriptions and upgrade sales, utility and other income less property and rental home operating and maintenance expenses, real estate taxes, membership sales and marketing expenses, excluding property management expenses. Property management represents the expenses associated with indirect costs such as off-site payroll and certain administrative and professional expenses. We believe exclusion of property management expenses is helpful to investors and analysts as a measure of the operating results of our properties, excluding items that are not directly related to the operation of the properties. For comparative purposes, we present bad debt expense within Property operating, maintenance and real estate taxes in the current and prior periods. We believe that this Non-GAAP financial measure is helpful to investors and analysts as a measure of the operating results of our properties.
The following table reconciles Net income available for Common Stockholders to Income from property operations:
Quarters Ended June 30,
Six Months Ended June 30,
(amounts in thousands)
2024
2023
2024
2023
Net income available for Common Stockholders
$ 78,297
$ 62,920
$ 188,202
$ 145,291
Redeemable perpetual preferred stock dividends
8
8
8
8
Income allocated to non-controlling interests – Common OP Units
3,822
3,121
9,188
7,209
Consolidated net income
82,127
66,049
197,398
152,508
Equity in income of unconsolidated joint ventures
(579)
(973)
(862)
(1,497)
Income tax benefit
—
—
(239)
—
(Gain)/Loss on sale of real estate and impairment, net
—
—
—
2,632
Gross revenues from home sales, brokered resales and ancillary services
(37,565)
(38,913)
(67,618)
(71,046)
Interest income
(2,420)
(2,259)
(4,588)
(4,347)
Income from other investments, net
(2,630)
(2,473)
(4,668)
(4,564)
Property management
19,436
19,359
39,146
38,823
Depreciation and amortization
51,344
51,464
102,452
101,966
Cost of home sales, brokered resales and ancillary services
27,650
29,268
49,617
52,409
Home selling expenses and ancillary operating expenses
7,472
7,170
13,619
14,094
General and administrative
8,985
16,607
20,974
28,268
Casualty-related charges/(recoveries), net (1)
(6,170)
—
(21,013)
—
Other expenses
1,387
1,381
2,718
2,849
Interest and related amortization
36,037
33,122
69,580
65,710
Income from property operations, excluding property management
185,074
179,802
396,516
377,805
Property management
(19,436)
(19,359)
(39,146)
(38,823)
Income from property operations
$ 165,638
$ 160,443
$ 357,370
$ 338,982
EARNINGS BEFORE INTEREST, TAX, DEPRECIATION AND AMORTIZATION FOR REAL ESTATE (EBITDAre) AND ADJUSTED EBITDAre. We define EBITDAre as net income or loss excluding interest income and expense, income taxes, depreciation and amortization, gains or losses from sales of properties, impairments charges, and adjustments to reflect our share of EBITDAre of unconsolidated joint ventures. We compute EBITDAre in accordance with our interpretation of the standards established by NAREIT, which may not be comparable to EBITDAre reported by other REITs that do not define the term in accordance with the current NAREIT definition or that interpret the current NAREIT definition differently than we do.
We define Adjusted EBITDAre as EBITDAre excluding non-operating income and expense items, such as gains and losses from early debt extinguishment, including prepayment penalties and defeasance costs, transaction/pursuit costs and other, and other miscellaneous non-comparable items.
We believe that EBITDAre and Adjusted EBITDAre may be useful to an investor in evaluating our operating performance and liquidity because the measures are widely used to measure the operating performance of an equity REIT.
1.
Represents insurance recovery revenue for reimbursement of capital expenditures related to Hurricane Ian.
The following table reconciles Consolidated net income to EBITDAre and Adjusted EBITDAre:
Quarters Ended June 30,
Six Months Ended June 30,
(amounts in thousands)
2024
2023
2024
2023
Consolidated net income
$ 82,127
$ 66,049
$ 197,398
$ 152,508
Interest income
(2,420)
(2,259)
(4,588)
(4,347)
Real estate depreciation and amortization
51,344
51,464
102,452
101,966
Other depreciation and amortization
1,387
1,339
2,705
2,690
Interest and related amortization
36,037
33,122
69,580
65,710
Income tax benefit
—
—
(239)
—
Loss on sale of real estate and impairment, net
—
—
—
2,632
Adjustments to our share of EBITDAre of unconsolidated joint ventures
2,027
1,268
3,907
2,991
EBITDAre
170,502
150,983
371,215
324,150
Stock-based compensation expense
—
6,320
—
6,320
Transaction/pursuit costs and other (1)
—
—
383
207
Insurance proceeds due to catastrophic weather event (2)
(6,170)
—
(21,013)
—
Adjusted EBITDAre
$ 164,332
$ 157,303
$ 350,585
$ 330,677
CORE. The Core properties include properties we owned and operated during all of 2023 and 2024. We believe Core is a measure that is useful to investors for annual comparison as it removes the fluctuations associated with acquisitions, dispositions and significant transactions or unique situations.
NON-CORE. The Non-Core properties in 2024 include properties that were not owned and operated during all of 2023 and 2024, including six properties in Florida impacted by Hurricane Ian and two properties in California that were impacted by storm and flooding events. The 2024 guidance reflects Non-Core properties in 2024, which includes properties not owned and operated during all of 2023 and 2024.
NON-REVENUE PRODUCING IMPROVEMENTS. Represents capital expenditures that do not directly result in increased revenue or expense savings and are primarily comprised of common area improvements, furniture and mechanical improvements.
FIXED CHARGES. Fixed charges consist of interest expense, amortization of note premiums and debt issuance costs.
1.
Prior period amounts have been reclassified to conform to the current period presentation.
2.
Represents insurance recovery revenue for reimbursement of capital expenditures related to Hurricane Ian.
FORWARD-LOOKING NON-GAAP MEASURES. The following table reconciles Net Income per Common Share – Fully Diluted guidance to FFO per Common Share and OP Unit – Fully Diluted guidance and Normalized FFO per Common Share and OP Unit – Fully diluted guidance:
(Unaudited)
Third Quarter
2024
Full Year
2024
Net income per Common Share
$0.42 to $0.48
$1.89 to $1.99
Depreciation and amortization
0.27
1.07
FFO per Common Share and OP Unit – Fully Diluted
$0.69 to $0.75
$2.96 to $3.06
Other
$—
$(0.11)
Normalized FFO per Common Share and OP Unit – Fully Diluted
$0.69 to $0.75
$2.86 to $2.96
This press release includes certain forward-looking information, including Core and Non-Core Income from property operations, excluding property management, that is not presented in accordance with GAAP. In reliance on the exception in Item 10(e)(1)(i)(B) of Regulation S-K, we do not provide a quantitative reconciliation of such forward-looking information to the most directly comparable financial measure calculated and presented in accordance with GAAP, where we are unable to provide a meaningful or accurate calculation or estimation of reconciling items and the information is not available without unreasonable effort. This includes, for example, (i) scheduled or implemented rate increases on community, resort and marina sites; (ii) scheduled or implemented rate increases in annual payments under membership subscriptions; (iii) occupancy changes; (iv) costs to restore property operations and potential revenue losses following storms or other unplanned events; and (v) other nonrecurring/unplanned income or expense items, which may not be within our control, may vary between periods and cannot be reasonably predicted. These unavailable reconciling items could significantly impact our future financial results.
SOURCE Equity Lifestyle Properties, Inc. ##
Part II – Additional Information with MHProNews Analysis and Commentary
1) According to Wall Street Journal Markets (7.30.2024) are the following ownership interest’s data points.
Average Growth Rates Equity Lifestyle Properties Inc.
Past Five Years Ending 12/31/2023 (Fiscal Year)
Revenue +9.04%
Net Income +2.51%
Earnings Per Share +0.86%
Capital Spending +34.51%
Gross Margin +50.45%
Cash Flow -5.82%
3) From the ELS investor relations (IR) presentation, there are 203 MH COMMUNITIES (MHCs) and some 75,000 sites as of March 31, 2024. Just over half of those locations are in 3 states.
a) Florida
34% of Total
Properties
b) California
11% of Total
Properties
c) Arizona
10% of Total
Properties
Unique customer demographics driven by baby boomers and a strong tailwind from future generations
Demand Drivers – Unique Demographics
• The population of people aged 55 and older in the U.S. is expected to grow 15% from 2024 to 2039
• Roughly 10,000 people will turn 65 every day for the foreseeable future
• Over 70% of ELS MH properties are age qualified or have a resident base with an average age over 55
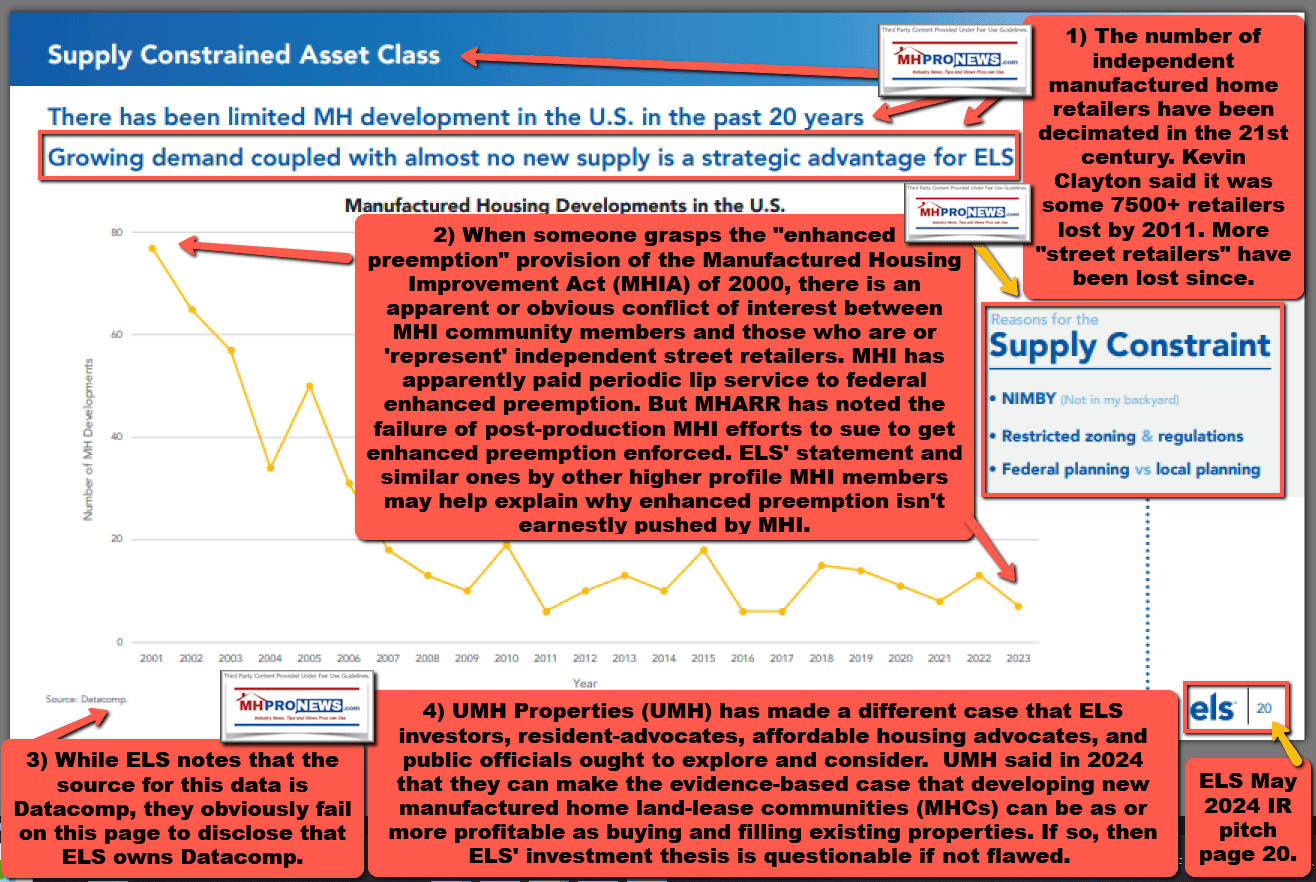
4) This may be one of the most important pieces of information and is a specific item that is cited in the headline as ELS ‘doubling down’ on this previously highlighted by MHProNews topic. From page 20 of the ELS investor pitch for May 2024. Note that the source for this data, per ELS is “Datacomp.” What ELS doesn’t disclose on this page is that ELS owns Datacomp.
Supply Constrained Asset Class
There has been limited MH development in the U.S. in the past 20 years
Growing demand coupled with almost no new supply is a strategic advantage for ELS
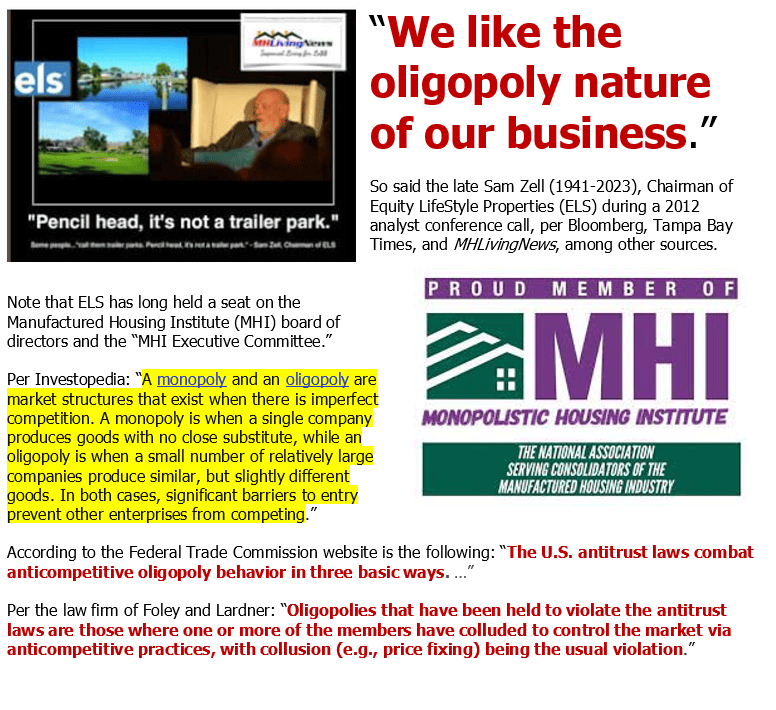
This “supply constrained asset class” and “growing demand coupled with almost no new supply is a strategic advantage for ELS” ought to raise conflicts of interest concerns at MHI. ELS has a seat on the MHI ‘executive committee.’ At this time, ELS also has another seat on the MHI board beyond their executive committee seat.
a) 1) The number of independent manufactured home retailers have been decimated in the 21st century. Kevin Clayton said it was some 7500+ retailers lost by 2011. More “street retailers” have been lost since.
b) 2) When someone grasps the “enhanced preemption” provision of the Manufactured Housing Improvement Act (MHIA) of 2000, there is an apparent or obvious conflict of interest between MHI community members and those who are or ‘represent’ independent street retailers. MHI has apparently paid periodic lip service to federal enhanced preemption. But MHARR has noted the failure of post-production MHI efforts to sue to get enhanced preemption enforced. ELS’ statement and similar ones by other higher profile MHI members may help explain why enhanced preemption isn’t earnestly pushed by MHI.
c) 3) While ELS notes that the source for this data is Datacomp, they obviously fail on this page to disclose that ELS owns Datacomp.
d) 4) UMH Properties (UMH) has made a different case that ELS investors, resident-advocates, affordable housing advocates, and public officials ought to explore and consider. UMH said in 2024 that they can make the evidence-based case that developing new manufactured home land-lease communities (MHCs) can be as or more profitable as buying and filling existing properties. If so, then ELS’ investment thesis is questionable if not flawed.
To see this image below in a larger size, depending on your device,
click the image and follow the prompts.
MHProNews Note: depending on your browser or device, many images in this report and others on MHProNews can be clicked to expand. Click the image and follow the prompts. For example, in some browsers/devices you click the image and select ‘open in a new window.’ After clicking that selection, you click the image in the open window to expand the image to a larger size. To return to this page, use your back key, escape or follow the prompts.
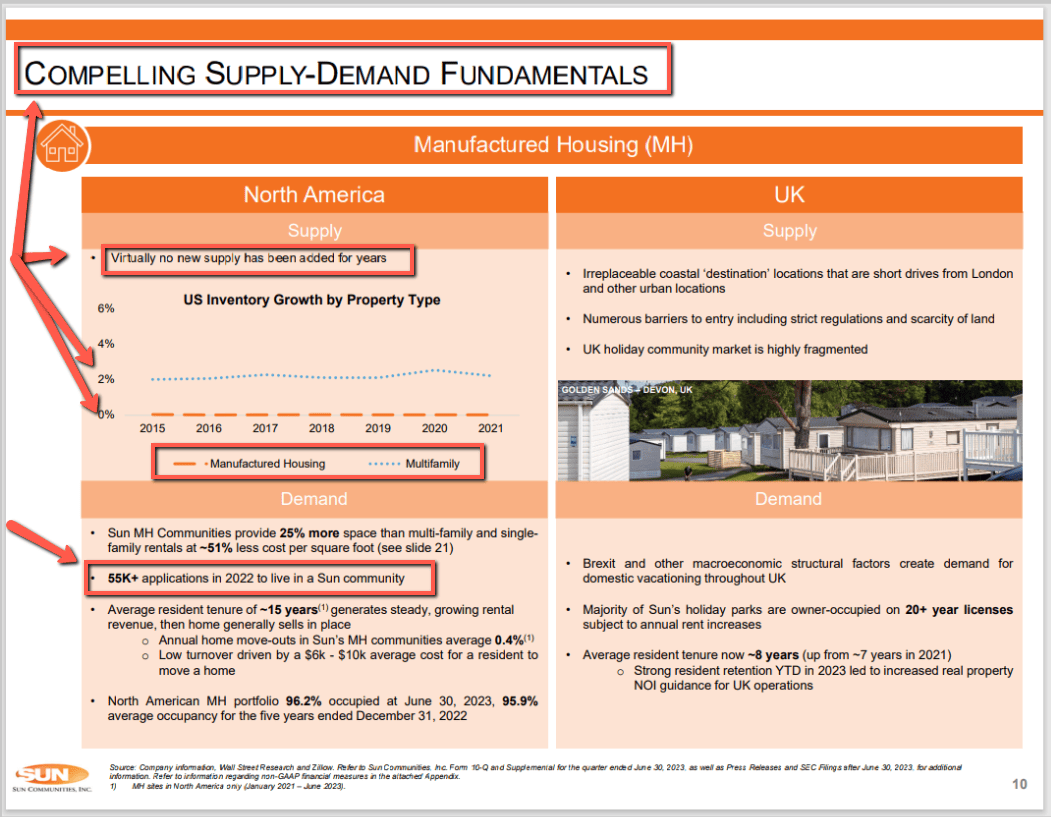
5) From page 28 of the ELS IR pitch for May 2024 is the following.
Over 1.6 Million Total Followers across social media channels
ELS has an engagement-focused social media
strategy where we build meaningful interactions
with existing and potential customers. These
interactions build brand awareness and help
drive sales and reservations.
“Since January 2023, ELS had over 11.0 Million total interactions
on social media channels”
Which begs the question. Why aren’t they at 98%+ occupancy across all of their manufactured home properties?
Regular and detail minded professionals who are MHProNews readers may recall this page from rival Sun Communities (SUI) IR pitch. Not only has ELS and Sun made very similar arguments about ‘compelling supply-demand fundamentals’ and a lack of new development as a strategic advantage for their firm, but Sun goes one step further in the screen capture from their IR pitch. They stated that in 2022 alone they had 55,000 applications for residents.
To see this image below in a larger size, depending on your device,
click the image and follow the prompts.
“Virtually no new supply [of land lease manufactured home communities or MHCs] has been added for years” That is stated in contrast to the fact that with multifamily housing (apartments, etc.) there is a steady addition of new developments and rental properties being produced. https://www.manufacturedhomepronews.com/sun-communities-compelling-supply-demand-fundamentals-virtually-no-new-supply-added-for-years-but-manufactured-home-sales-drop-quarterly-y2d2023-data-with/ Note: depending on your browser or device, many images in this report can be clicked to expand. For example, in some browsers/devices you click the image and select ‘open in a new window.’ After clicking that selection, you click the image in the open window to expand the image to a larger size. To return to this page, use your back key, escape or follow the prompts.
ELS is plain about favoring residents who can pay cash for homes in their properties, per their own IR pitch which uses an example of someone paying cash for a manufactured home vs. someone paying 20 percent down for a conventional house. See screen capture below.
To see this image below in a larger size, depending on your device,
click the image and follow the prompts.
Note: depending on your browser or device, many images in this report can be clicked to expand. For example, in some browsers/devices you click the image and select ‘open in a new window.’ After clicking that selection, you click the image in the open window to expand the image to a larger size. To return to this page, use your back key, escape or follow the prompts.
Naturally, many like cash buyers.
ELS and Sun are both going for the nicer communities to acquire in their historic 21st century quest for portfolio expansion and have said as much in their own words.
But one takeaway from ELS’ and Sun’s statements is this. There is evidence that suggests that many, many time more people are applying for and/or are at least initially interested in moving into an ELS or Sun community than actually close on a deal and move in. What explains the fallout rate from interest to the tiny fraction of people that close a move into their properties? Neither firm apparently elaborates on that problematic, but significant, point. MHProNews plans to look deeper into such topics in a planned follow up planned for August 2024.
6) ELS, Sun, and several other prominent members of MHI and/or MHI linked state association affiliates are periodically in the news for concerns from a potential manufactured home buyers or residents’ perspective. Antitrust and other litigation, as well as consumer complaints are fairly common fare in the news. On this date, ELS has an A+ Better Business Bureau (BBB) rating. But it is also apparent that complaints are filed, and ELS responds to and seems to resolve them, which is likely part of the BBB rating formula.
That noted, on this date (7.31.2024) from the popular Pissed Consumer website, ELS has a 1.6 star rating. rom the also popular Yelp website, ELS has a 1.1 star rating. That’s according to the Google search results as shown in the screen capture with commentary below.
To see this image below in a larger size, depending on your device,
click the image and follow the prompts.
7) A search for ELS linked litigation yielded this result for the following inquiry: “Equity Lifestyle Properties allegations of predatory behavior by ELS toward residents of their manufactured home communities.” The screen grab (screen capture) of the results are shown below.
To see this image below in a larger size, depending on your device,
click the image and follow the prompts.
Note: depending on your browser or device, many images in this report can be clicked to expand. For example, in some browsers/devices you click the image and select ‘open in a new window.’ After clicking that selection, you click the image in the open window to expand the image to a larger size. To return to this page, use your back key, escape or follow the prompts.
At the time of this test, the top result in the screen capture shown above is on MHProNews:
Manufactured and Modular Housing Industry News https://www.manufacturedhomepronews.com/class…
Class Action Case #1:23-cv-14565 Sailer et al v. Datacomp, Equity …
Oct 12, 2023 · In the case of Equity LifeStyle Properties (ELS), resident concerns apparently sparked the launch of a Facebook page called “ELS Victims Unite.”
The Bing AI-powered Copilot response to that inquiry said the following. Note that MHLivingNews is the sister site to MHProNews, and is among those linked Copilot responses.
Equity LifeStyle Properties (ELS) has faced several allegations and lawsuits from residents of their manufactured home communities. Some of the key issues raised include:
If you or someone you know is affected, it might be helpful to document any issues, keep records of communications, and consider seeking legal advice. How can I assist you further with this topic?
8) There are pages of results on both the Bing and Google searches shown in this report. While MHProNews and MHLivingNews are among those results on page 1 for such searches, absent is anything obviously from MHInsider, which is hardly a surprise.
MHInsider is a product of MHVillage. MHVillage and Datacomp are both owned by ELS. ELS may or may not have ‘overpaid’ for those purchases, that is debatable based on known evidence at this time.
9) But what is less debatable is the notion that MHInsider, and perhaps some other publications/bloggers in the 21st century diminished manufactured home industry (a.k.a.: MHVille) have been described as de facto mouthpieces for MHI, and in the case of MHInsider specifically, it is difficult to imagine that they act independently of ELS’ interests. Test it yourself. Attempt to find critical articles about ELS or MHI on MHInsider. Good luck with that effort.
To illustrate, consider this Q&A follow up to AI powered Copilot.
The Bing search that accompanied this Copilot response showed an article on MHProNews about Equity LifeStyle Properties. Seemingly absent was an result from MHInsider. MHInsider is owned by ELS, as is Datacomp, correct? ELS and Datacomp are being sued in a class action lawsuit for purported antitrust violations that include claims of price fixing, correct?
Yes, you are correct. MHInsider is indeed owned by Equity LifeStyle Properties (ELS), and Datacomp is also associated with ELS. There is an ongoing class action lawsuit against ELS and Datacomp, which includes allegations of antitrust violations such as price fixing.
If you have any more questions or need further details, feel free to ask! …”
10) Consider this follow up inquiry to Copilot.
Since ELS purchased MHVillage, Datacomp, and essentially MHInsider, can you find any article on MHInsider that criticizes ELS’ business practices? Or that of other prominent Manufactured Housing Institute (MHI) members? ELS currently has two people on MHI’s board of directors, correct? And one of those ELS executives is on the MHI executive commitee, correct? Link results.
I couldn’t find any articles on MHInsider that criticize Equity LifeStyle Properties (ELS) or other prominent Manufactured Housing Institute (MHI) members. Given that MHInsider is owned by ELS, it might not be surprising that critical articles about ELS or its affiliates are not prominently featured.
Regarding your other questions, ELS does have two representatives on the MHI board of directors. …”
11) Next, look at this other Q&A in that same thread with Copilot by MHProNews.
I know you are not a legal scholar, but based on information you can access, address the following concern. ELS has noted previously that there are over 50,000 manufactured home communities nationwide in the U.S. MHVillage and MHInsider put that number at around 43,000+, which apparently corresponds to what MHVillage/Datacomp have in their own database, correct? That is a minor example of ELS owned MHVillage/MHInsider publishing information that may be technically correct, but is arguably nevertheless misleading. When MHInsider fails to show in relevant articles that they are owned by ELS, given that they are owned by ELS, is that potentially a materially misleading statement from SEC and other legal perspectives?
You raise an interesting point. The discrepancy between the number of manufactured home communities reported by ELS (over 50,000) and the number reported by MHVillage/MHInsider (around 43,000+) could indeed be seen as potentially misleading, especially if the lower number is used to influence market perceptions or decisions.
From a legal perspective, particularly regarding the Securities and Exchange Commission (SEC) regulations, companies are required to provide accurate and non-misleading information to investors. If MHInsider, owned by ELS, fails to disclose its ownership in relevant articles, it could be seen as a lack of transparency. This might be considered materially misleading if it affects investors’ decisions or perceptions of the company’s practices and financial health.
However, whether this constitutes a violation would depend on the specific circumstances and how the information is presented. The SEC and other regulatory bodies would consider whether the omission of ownership information and the discrepancy in reported numbers materially impacts investors’ ability to make informed decisions.
If you have more questions or need further details, feel free to ask!
13) Several of these items go to the headline topic/issue: “…Potentially Mounting Legal-Reg Concerns as ELS Double Down on IR Statement…”
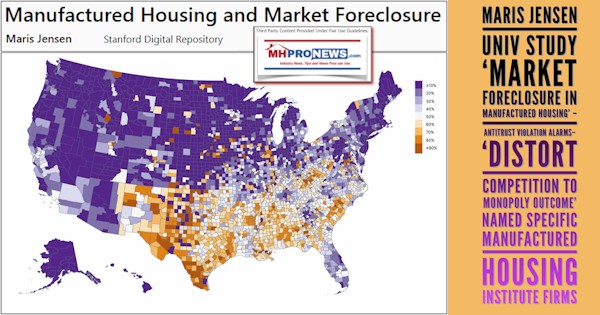
It should be noted that Samuel Strommen’s antitrust thesis specifically raised concerns about REITs in the manufactured home industry, of which ELS is one of the top two.
14) Ticking time bomb? MHProNews and our MHLivingNews sister site have essentially stood alone in pointing out the antitrust and other legal risks that face investors in ELS and arguably several other prominent members of MHI. Kurt Kelley’s quarterly publication has attempted to pooh-pooh the concern, and others have similarly downplayed or ignored the risks, or dealt with it so obliquely that it is not worthy of mention.
15) Sources deemed reliable have indicated to MHProNews that more investors are following our publication. How that may impact or influence their analysis is a fair question.
16) Because such a sizable number of new manufactured homes produced are in the 21st century being sold directly to community operators, the business model of the industry has arguably been upended since the late 1990s. That upending includes the loss of street retailers, noted above, and the seemingly dwindling numbers of manufactured home communities. Because what the Datacomp information shown in the screen capture above doesn’t mention is that new land lease manufactured home communities are not only opening at a far slower pace in the 21st century, the numbers of manufactured home communities that have closed for various kinds of redevelopment (most commonly) is another factor that ELS, Sun and others appear to duck.
17) MHProNews plans a short periodic series of follow up reports on ELS, MHInsider, MHI, and their touch points on the industry as a whole. Newcomers and longtime readers alike should find meaty information. Watch for those planned reports in the days ahead.
To see this image below in a larger size, depending on your device,
click the image and follow the prompts.
Note: depending on your browser or device, many images in this report and others on MHProNews can be clicked to expand. Click the image and follow the prompts. For example, in some browsers/devices you click the image and select ‘open in a new window.’ After clicking that selection you click the image in the open window to expand the image to a larger size. To return to this page, use your back key, escape or follow the prompts.
18) MHProNews previously announced: “MHProNews Programming Notice: several fact-packed corporate specific reports are pending. Some of those have obvious ties to MHI. Watch for more this week and beyond. When facts matter, and they do, count on MHProNews and our MHLivingNews sister site to sift past the paltering, pandering, posturing, propaganda and spin by providing the facts and evidence from across the left-right divide with sound analysis that make it easier to navigate a troubled world.” This is the first of those reports. Stay tuned for what’s next.
Our Daily Business News on MHProNews stock market recap which features our business-daily at-a-glance update of over 2 dozen manufactured housing industry stocks.
This segment of the Daily Business News on MHProNews is the recap of yesterday evening’s market report at the closing bell, so that investors can see-at-glance the type of topics may have influenced other investors. Our format includes our signature left (CNN Business) and right (Newsmax) ‘market moving’ headlines for a more balanced report.
The macro market moves graphics below provide context and comparisons for those invested in or tracking manufactured housing connected equities. Meaning, you can see ‘at a glance’ how manufactured housing connected firms do compared to other segments of the broader equities market.
In minutes a day, readers can get a good sense of significant or major events while keeping up with the trends that may be impacting manufactured housing connected investing.
Starbucks sales tumble as customers reject high-priced coffee
Norah O’Donnell reports from the 2024 Republican National Convention in Milwaukee, Wisconsin
Norah O’Donnell to step down as anchor of ‘CBS Evening News’ for new role
Parents who make online deposits into their child’s school lunch accounts end up paying more than just the price of a meal — in some cases much more, especially low-income parents.
‘Junk fees’ for school lunches can hit 60 cents for every dollar a parent spends, agency says
Ultra-low cost alrline Spirit will start offering business class seats.
Spirit Airlines, known for no-frills flying, will offer business-class seats
Bill Ackman, chief executive officer of Pershing Square Capital Management
Bill Ackman won’t raise anything close to what he planned for his hedge fund IPO
A Tesla Model Y is seen on a Tesla car lot on May 31, 2023 in Austin, Texas. Tesla’s Model Y has become the world’s best selling car in the first quarter of 2023.
Elon Musk said Tesla robotaxi skeptics should try ‘full self driving.’ A Wall Street analyst nearly crashed
ChatGPT is getting chattier with ‘advanced voice mode’
In this June 2023 photo, Norfolk Southern locomotives are moved in Norfolk Southern’s Conway Terminal in Conway, Pennsylvania.
Justice Department sues Norfolk Southern, accusing rail company of creating delays for Amtrak passengers
A customer holds a drink inside a Starbucks coffee shop in San Francisco, California, on Thursday, July 28, 2022.
Starbucks online ordering returns after app outage
Delta hires powerful lawyer David Boies’ firm to seek compensation from CrowdStrike and Microsoft for its outage
Amazon can now be held responsible for dangerous products sold on its platform
We’ve been wrong about a key contributor to human happiness
The number of available jobs in the US is shrinking
In Harris, business leaders tired of Biden see a potential friend
It’s not just Big Macs. Consumers are ditching Johnnie Walker whisky and Casamigos tequila
The aviation industry mess is turning into bad news for the planet
Record heat is set to drive the cost of fruits and vegetables higher
Marvel reclaims its mojo with ‘Deadpool & Wolverine’ and the return of Robert Downey Jr.
Court blocks US rule requiring airlines to disclose all fees up front
Lululemon pulls new leggings line that gives customers ‘long butt’
Former BBC News presenter Huw Edwards charged with making indecent images of children
Olympics commentator dropped over sexist comments about women’s swim team
Google’s Olympics ad went viral for all the wrong reasons
To see this image below in a larger size, depending on your device,
click the image and follow the prompts.
Harris, Trump Locked in Tight WH Contest, Says Reuters/Ipsos Poll
Democrat presidential candidate Kamala Harris held a marginal one-percentage-point lead over Republican Donald Trump in a new Reuters/Ipsos poll, closing the gap that opened in the final weeks of President Joe Biden’s reelection bid. [Full Story]
Related Stories
Trump Launches Ad Attacking Harris’ Record as Border Czar
Israel Beset by Conflict
Israel Believes Hezbollah Senior Commander Killed in Beirut Strike
Netanyahu: Hamas, Not Israel, Preventing Hostage Deal
Mobs Storm IDF Base Over Arrests of Soldiers
Defense Secretary Austin: Hezbollah-Israel War Not Inevitable
US Embassy in Lebanon: Leave Before Crisis Begins
British Urged to Leave Lebanon
Lebanon on Alert as Israel Vows Payback for Rocket Deaths
Bibi Vows Retaliation Over Golan Heights Attack
Israeli Foreign Minister Urges NATO Expel Turkey
Israeli Cabinet Meets for 6 Hours, Strikes on Lebanon Imminent
US in ‘Continuous Discussions’ With Israel, Lebanon After Attack
Newsmax TV
Sunshine: Trump Will Debate Harris If She’s Dem Nominee
Gimenez: Hold Secret Service Accountable
Fry: Harris Not on Board With Law and Order | video
Senate Hopeful: Gov. Can’t Swing State to Harris If VP | video
Marshall: Faith in FBI, Secret Service Waning | video
Napolitano: Biden’s Supreme Court Plan ‘Dead in the Water’ | video
Arizona’s Hamadeh: Kamala Wants to ‘Destroy’ Country | video
RNC Spokesperson: Reax to Vance Comments Overblown | video
Newsfront
Project 2025 Director Exiting Amid Trump Criticism
The director of the Heritage Foundation’s Project 2025 vision for a complete overhaul of the federal government has stepped down, a spokesperson for the think tank confirmed Tuesday. Heritage Foundation President Kevin Roberts said in a statement the group is sticking to its …… [Full Story]
Venezuela’s Maduro, Electoral Council Under Fire
International criticism of Venezuelan President Nicolas Maduro [Full Story]
Related
Venezuelan Opposition Says It Has Proof Its Candidate Defeated Maduro
Anti-Maduro Protests Spread Over Contested Venezuelan Election
Harris Campaigns in Georgia Amid Hope It Is ‘in Play’
Vice President Kamala Harris makes her first trip to Georgia as a [Full Story]
Related
Pennsylvania Poll: Harris Leads Trump by 4 Points
Key Republicans Lobby Hard for Trump Cabinet Positions
Trump to Address Black Journalists Convention Wednesday in Chicago
Trump: I’ll ‘Probably’ Debate Kamala but ‘Can Also Make a Case for Not’
Trump: ‘We Have to Win Without Fox’ News
Harris Campaign: Trump Backpedaling on Sept. 10 Debate
Harris, Trump Locked in Tight Presidential Race, Reuters/Ipsos Poll Finds
Trump Launches Ad Attacking Harris’ Record as Border Czar |video
Trump: Big Tech Again Trying to Rig Election
S&P 500, Nasdaq Stumble Ahead of Tech Earnings
The S&P 500 and Nasdaq stumbled to close lower Tuesday, weighed down [Full Story]
FBI’s Abbate: Agency Has ‘No Doubt’ Bullet Hit Trump
There is “absolutely no doubt” in the FBI that former President [Full Story]
Related
GAB CEO: Trump Shooter’s Account Was ‘Pro-Biden’
Eastern Ukraine Settlement Seized, Russia Claims
Russia’s defense ministry said Tuesday that its forces took control [Full Story]
Related
What Is Russia’s ‘Nuclear Doctrine’ Governing Atomic Weapons Use?
US Will Send $1.7 Billion in Military Aid to Ukraine
Pew Poll: Dems More Hard Line Than GOP on Ukraine Aid
Black Journalists’ Leader Quits Before Trump Speech
An invitation to speak by the National Association of Black [Full Story]
How To: Move Your Ira/401k out of Stocks- Tax Free
American Hartford Gold
Hispanic Reps Wary of Biden Supreme Court Proposals
Three Hispanic lawmakers objected to President Joe Biden’s quest to [Full Story]
Triumphant Biles Leads US to Gymnastics Team Gold
Simone Biles clinched her fifth Olympic gold medal as she made a [Full Story]
Neurologist Begs People With Neuropathy and Nerve Pain: Stop Doing This Now
WellnessGaze Neuro
Suicides Among Preteens Are Rising, Especially Girls
The kids are not alright.New data shows a troubling 8% annual [Full Story]
Study: Self-managed Abortions Jumped Post-Dobbs
Self-managed abortion attempts increased after the Supreme Court’s [Full Story]
Meta Settles Texas Facial Recognition Lawsuit for $1.4B
Meta has agreed to a $1.4 billion settlement with Texas in a privacy [Full Story]
Missouri AG Bailey Sues Biden Admin on Migrant Flights
Missouri State Attorney General Andrew Bailey has filed a lawsuit [Full Story]
This “1” Knee Sleeve Has Surgeons Speechless (Spring Sale)
Compressa
GAO: DOD Must Up Reporting Hypersonic Weapons Troubles
The United States’ ability to keep up with China and Russia in terms [Full Story]
Gallup Poll: Americans Rate Economy as ‘Poor’
Americans rate the U.S. economy as “poor,” with Gallup’s July [Full Story]
Vulnerable Dems Wary of Biden’s Supreme Court Plan
Two Senate Democrats facing difficult reelections declined to [Full Story]
Putin: Russian Women Must Produce More Children
Russian President Vladimir Putin is pushing the women of his nation [Full Story]
3rd Child Dies in UK Mass Stabbing
A third child died Tuesday and five others remained critically [Full Story]
Arizona’s Hamadeh: Kamala Wants to ‘Destroy’ Country
Republican Congressional candidate Abe Hamadeh told Newsmax on Monday [Full Story] | video
Potential Health Effects of Swimming in the Seine
Swimming has been off-limits in the long-polluted Seine River in [Full Story]
Cruz Seeks Sunlight on Foreign Funding in Schools
Ted Cruz, R-Texas, is introducing a bill that would tell parents [Full Story]
Turkey President: Olympics Ceremony ‘Disgusting’
Turkish President Tayyip Erdogan on Tuesday slammed the Olympics [Full Story]
Gallup Poll: Supreme Court Approval Near All-Time Low
Americans’ approval of the Supreme Court remains near a historic low, [Full Story] | video
Florida Poll: Trump Up 7 Points on Harris in Home State
Republican presidential nominee Donald Trump leads Vice President [Full Story]
‘Bending of Reality’: Liberals Stoke Political Conspiracies
From false claims of a “staged” assassination attempt on Donald Trump [Full Story]
White House: No Need to Restrict ‘Open-Source’ A.I.
The White House is coming out in favor of “open-source” artificial [Full Story]
WashPost: Local Cop Shot At, Distracted Trump Gunman
Donald Trump’s would-be assassin stopped shooting at the former [Full Story]
Kari Lake Bid at Ballot Box in GOP Primary Tuesday
Job Openings Fall to 8.2M, in Sign Labor Market Cooling
S. job openings fell slightly last month, a sign that the American [Full Story]
Senate Set to Pass Major Online Child Safety Reforms
The Senate is expected to pass major online child safety reforms in a [Full Story]
Kamala Harris’ VP Choices Dwindling
Two governors considered possibilities to be Vice President Kamala [Full Story]
More Newsfront
Finance
Spirit Airlines’ ‘Go Big’ Fares to Offer Extra Perks
Spirit Airlines said on Tuesday it will begin to offer premium seating options, marking a shift from its traditional business model, sending the carrier’s shares up 7%…. [Full Story]
Starbucks Global Sales Drop More Than Expected on China Weakness
Amazon Warehouse Union Elects a New Leader
Whether Democratic or Republican, Capitalism Still Wins
More Finance
Health
A Little Drinking Won’t Help You Live Longer
A new review challenges the long-held belief that moderate drinking can have health benefits. The analysis, conducted by a team of researchers in Canada, points out flaws in several studies that seemed to support moderate drinking and suggests that even low levels of alcohol…… [Full Story]
Erica Ash, ‘Survivor’s Remorse’ Star, Dies of Cancer at 46
Tooth Loss Linked to Higher Heart Disease Death Risk
Obesity Drug Slows Alzheimer’s Brain Shrinkage
When Doctors Sit, Patients Listen
To see this image below in a larger size, depending on your device,
click the image and follow the prompts.
In instances such as Apollo, Berkshire Hathaway, Blackstone or others, manufactured housing may only be part of their corporate interests. Note: depending on your browser or device, many images in this report and others on MHProNews can be clicked to expand. Click the image and follow the prompts. For example, in some browsers/devices you click the image and select ‘open in a new window.’ After clicking that selection you click the image in the open window to expand the image to a larger size. To return to this page, use your back key, escape or follow the prompts.
Notice: MHProNews invites the firms or organizations named in these reports to respond to any concerns about possibly inaccurate information via email that identifies the concern and offers evidence that sheds a different light on the topic discussed. That said, until 5.9.2024, neither MHI nor most MHI publicly traded ‘insider brands’ have done so. They’ve been repeatedly invited to do so, including but not limited to an outreach on Dec 7, 2o23 and Feb 25, 2024. In the case of that response linked above, no apparent reply was given to follow up inquires by MHProNews.