Some 90 days (i.e.: 3 months) of national manufactured housing production and shipment data on a state-by-state basis reveal significant insights useful for all serious affordable housing advocates, manufactured home professionals, investors, public officials and others. First up will be data for all 50 states, Washington, D.C. and Puerto Rico for August 2022 released just days ago on October 3, 2022. That will be followed by July and June data. Some snippets of data will then be ‘pulled’ from those monthly reports to reveal some insights that nonprofits, business owners, investors, politicos, and others are unlikely to find published anywhere else in the U.S.
The Institute for Building Technology and Safety (IBTS) gathers this data on behalf of the U.S. Department of Housing and Urban Development (HUD). The monthly national snapshot by the Manufactured Housing Association for Regulatory Reform (MHARR) is found further below among our headlines for the Sunday week in review.
| Institute for Building Technology & Safety | ||||||||
| Shipments and Production Summary Report | ||||||||
| 08/01/2022 – 08/31/2022 | ||||||||
| Shipments | ||||
| State | SW (single section) | MW (multi-section) | Total | Floors |
| Dest. Pending | 12 | 11 | 23 | 34 |
| Alabama | 563 | 208 | 771 | 980 |
| Alaska | 4 | 0 | 4 | 4 |
| Arizona | 63 | 216 | 279 | 500 |
| Arkansas | 54 | 86 | 140 | 226 |
| California | 44 | 308 | 352 | 673 |
| Colorado | 139 | 49 | 188 | 237 |
| Connecticut | 5 | 5 | 10 | 15 |
| Delaware | 28 | 17 | 45 | 64 |
| District of Columbia | 0 | 0 | 0 | 0 |
| Florida | 256 | 651 | 907 | 1,563 |
| Georgia | 130 | 260 | 390 | 651 |
| Hawaii | 0 | 0 | 0 | 0 |
| Idaho | 14 | 52 | 66 | 119 |
| Illinois | 67 | 42 | 109 | 151 |
| Indiana | 229 | 78 | 307 | 385 |
| Iowa | 41 | 17 | 58 | 75 |
| Kansas | 68 | 14 | 82 | 96 |
| Kentucky | 140 | 168 | 308 | 477 |
| Louisiana | 198 | 155 | 353 | 508 |
| Maine | 43 | 51 | 94 | 145 |
| Maryland | 8 | 2 | 10 | 12 |
| Massachusetts | 11 | 12 | 23 | 35 |
| Michigan | 285 | 235 | 520 | 755 |
| Minnesota | 34 | 50 | 84 | 134 |
| Mississippi | 112 | 139 | 251 | 390 |
| Missouri | 60 | 86 | 146 | 232 |
| Montana | 11 | 29 | 40 | 69 |
| Nebraska | 18 | 4 | 22 | 26 |
| Nevada | 11 | 70 | 81 | 153 |
| New Hampshire | 7 | 24 | 31 | 55 |
| New Jersey | 32 | 19 | 51 | 70 |
| New Mexico | 74 | 96 | 170 | 267 |
| New York | 71 | 132 | 203 | 335 |
| North Carolina | 289 | 276 | 565 | 841 |
| North Dakota | 23 | 19 | 42 | 61 |
| Ohio | 161 | 54 | 215 | 269 |
| Oklahoma | 154 | 112 | 266 | 378 |
| Oregon | 16 | 148 | 164 | 316 |
| Pennsylvania | 73 | 107 | 180 | 287 |
| Rhode Island | 1 | 4 | 5 | 9 |
| South Carolina | 151 | 255 | 406 | 663 |
| South Dakota | 25 | 23 | 48 | 71 |
| Tennessee | 102 | 214 | 316 | 530 |
| Texas | 998 | 858 | 1,856 | 2,729 |
| Utah | 3 | 26 | 29 | 57 |
| Vermont | 7 | 20 | 27 | 47 |
| Virginia | 81 | 67 | 148 | 215 |
| Washington | 9 | 131 | 140 | 278 |
| West Virginia | 26 | 65 | 91 | 156 |
| Wisconsin | 26 | 36 | 62 | 98 |
| Wyoming | 37 | 7 | 44 | 51 |
| Canada | 0 | 0 | 0 | 0 |
| Puerto Rico | 0 | 0 | 0 | 0 |
| Total | 5,014 | 5,708 | 10,722 | 16,492 |
| THE ABOVE STATISTICS ARE PROVIDED AS A MONTHLY | ||||
| SUBSCRIPTION SERVICE. REPRODUCTION IN PART OR | ||||
| IN TOTAL MUST CARRY AN ATTRIBUTION TO IBTS, INC. | ||||
| Production | ||||
| State | SW | MW | Total | Floors |
| States Shown(*) | 410 | 347 | 757 | 1,106 |
| Alabama | 859 | 754 | 1,613 | 2,371 |
| *Alaska | 0 | 0 | 0 | 0 |
| Arizona | 44 | 229 | 273 | 508 |
| *Arkansas | 0 | 0 | 0 | 0 |
| California | 45 | 300 | 345 | 657 |
| *Colorado | 0 | 0 | 0 | 0 |
| *Connecticut | 0 | 0 | 0 | 0 |
| *Delaware | 0 | 0 | 0 | 0 |
| *District of Columbia | 0 | 0 | 0 | 0 |
| Florida | 150 | 281 | 431 | 716 |
| Georgia | 213 | 434 | 647 | 1,082 |
| *Hawaii | 0 | 0 | 0 | 0 |
| Idaho | 29 | 135 | 164 | 304 |
| *Illinois | 0 | 0 | 0 | 0 |
| Indiana | 646 | 393 | 1,039 | 1,432 |
| *Iowa | 0 | 0 | 0 | 0 |
| *Kansas | 0 | 0 | 0 | 0 |
| *Kentucky | 0 | 0 | 0 | 0 |
| *Louisiana | 0 | 0 | 0 | 0 |
| *Maine | 0 | 0 | 0 | 0 |
| *Maryland | 0 | 0 | 0 | 0 |
| *Massachusetts | 0 | 0 | 0 | 0 |
| *Michigan | 0 | 0 | 0 | 0 |
| Minnesota | 70 | 91 | 161 | 252 |
| *Mississippi | 0 | 0 | 0 | 0 |
| *Missouri | 0 | 0 | 0 | 0 |
| *Montana | 0 | 0 | 0 | 0 |
| *Nebraska | 0 | 0 | 0 | 0 |
| *Nevada | 0 | 0 | 0 | 0 |
| *New Hampshire | 0 | 0 | 0 | 0 |
| *New Jersey | 0 | 0 | 0 | 0 |
| *New Mexico | 0 | 0 | 0 | 0 |
| *New York | 0 | 0 | 0 | 0 |
| North Carolina | 175 | 267 | 442 | 711 |
| *North Dakota | 0 | 0 | 0 | 0 |
| *Ohio | 0 | 0 | 0 | 0 |
| *Oklahoma | 0 | 0 | 0 | 0 |
| Oregon | 23 | 270 | 293 | 573 |
| Pennsylvania | 234 | 372 | 606 | 980 |
| *Rhode Island | 0 | 0 | 0 | 0 |
| *South Carolina | 0 | 0 | 0 | 0 |
| *South Dakota | 0 | 0 | 0 | 0 |
| Tennessee | 663 | 840 | 1,503 | 2,343 |
| Texas | 1,453 | 995 | 2,448 | 3,457 |
| *Utah | 0 | 0 | 0 | 0 |
| *Vermont | 0 | 0 | 0 | 0 |
| *Virginia | 0 | 0 | 0 | 0 |
| *Washington | 0 | 0 | 0 | 0 |
| *West Virginia | 0 | 0 | 0 | 0 |
| *Wisconsin | 0 | 0 | 0 | 0 |
| *Wyoming | 0 | 0 | 0 | 0 |
| *Canada | 0 | 0 | 0 | 0 |
| *Puerto Rico | 0 | 0 | 0 | 0 |
| Total | 5,014 | 5,708 | 10,722 | 16,492 |
| (*) THESE STATES HAVE FEWER THAN THREE PLANTS. | ||||
| FIGURES ARE AGGREGATED ON FIRST LINE ABOVE | ||||
| TOTALS TO PROTECT PROPRIETARY INFORMATION. | ||||
Ashok K Goswami, PE, COO, 45207 Research Place, Ashburn, VA
| Institute for Building Technology & Safety |
| Shipments and Production Summary Report |
07/01/2022 – 07/31/2022
| Shipments | ||||
| State | SW | MW | Total | Floors |
| Dest. Pending | 4 | 12 | 16 | 28 |
| Alabama | 237 | 191 | 428 | 619 |
| Alaska | 0 | 0 | 0 | 0 |
| Arizona | 38 | 160 | 198 | 360 |
| Arkansas | 40 | 57 | 97 | 154 |
| California | 50 | 255 | 305 | 572 |
| Colorado | 46 | 37 | 83 | 120 |
| Connecticut | 3 | 3 | 6 | 9 |
| Delaware | 7 | 15 | 22 | 37 |
| District of Columbia | 0 | 0 | 0 | 0 |
| Florida | 180 | 491 | 671 | 1,167 |
| Georgia | 139 | 199 | 338 | 538 |
| Hawaii | 0 | 0 | 0 | 0 |
| Idaho | 4 | 50 | 54 | 108 |
| Illinois | 57 | 29 | 86 | 116 |
| Indiana | 127 | 65 | 192 | 257 |
| Iowa | 22 | 7 | 29 | 36 |
| Kansas | 47 | 10 | 57 | 67 |
| Kentucky | 78 | 170 | 248 | 418 |
| Louisiana | 200 | 152 | 352 | 504 |
| Maine | 26 | 39 | 65 | 104 |
| Maryland | 12 | 3 | 15 | 18 |
| Massachusetts | 7 | 3 | 10 | 13 |
| Michigan | 214 | 192 | 406 | 598 |
| Minnesota | 29 | 26 | 55 | 81 |
| Mississippi | 120 | 132 | 252 | 384 |
| Missouri | 59 | 63 | 122 | 185 |
| Montana | 10 | 23 | 33 | 56 |
| Nebraska | 17 | 8 | 25 | 33 |
| Nevada | 7 | 46 | 53 | 101 |
| New Hampshire | 11 | 19 | 30 | 49 |
| New Jersey | 28 | 13 | 41 | 54 |
| New Mexico | 65 | 67 | 132 | 200 |
| New York | 36 | 88 | 124 | 212 |
| North Carolina | 272 | 214 | 486 | 700 |
| North Dakota | 20 | 14 | 34 | 48 |
| Ohio | 91 | 42 | 133 | 175 |
| Oklahoma | 92 | 75 | 167 | 242 |
| Oregon | 10 | 104 | 114 | 224 |
| Pennsylvania | 67 | 74 | 141 | 215 |
| Rhode Island | 2 | 0 | 2 | 2 |
| South Carolina | 103 | 195 | 298 | 494 |
| South Dakota | 7 | 20 | 27 | 47 |
| Tennessee | 71 | 181 | 252 | 433 |
| Texas | 728 | 738 | 1,466 | 2,214 |
| Utah | 3 | 27 | 30 | 59 |
| Vermont | 6 | 8 | 14 | 22 |
| Virginia | 37 | 38 | 75 | 113 |
| Washington | 8 | 121 | 129 | 257 |
| West Virginia | 18 | 45 | 63 | 109 |
| Wisconsin | 21 | 27 | 48 | 75 |
| Wyoming | 22 | 4 | 26 | 30 |
| Canada | 0 | 0 | 0 | 0 |
| Puerto Rico | 0 | 0 | 0 | 0 |
| Total | 3,498 | 4,552 | 8,050 | 12,657 |
| THE ABOVE STATISTICS ARE PROVIDED AS A MONTHLY | ||||
| SUBSCRIPTION SERVICE. REPRODUCTION IN PART OR | ||||
| IN TOTAL MUST CARRY AN ATTRIBUTION TO IBTS, INC. | ||||
| Production | ||||
| State | SW | MW | Total | Floors |
| States Shown(*) | 343 | 298 | 641 | 943 |
| Alabama | 584 | 656 | 1,240 | 1,896 |
| *Alaska | 0 | 0 | 0 | 0 |
| Arizona | 25 | 166 | 191 | 359 |
| *Arkansas | 0 | 0 | 0 | 0 |
| California | 41 | 250 | 291 | 552 |
| *Colorado | 0 | 0 | 0 | 0 |
| *Connecticut | 0 | 0 | 0 | 0 |
| *Delaware | 0 | 0 | 0 | 0 |
| *District of Columbia | 0 | 0 | 0 | 0 |
| Florida | 46 | 224 | 270 | 499 |
| Georgia | 157 | 428 | 585 | 1,014 |
| *Hawaii | 0 | 0 | 0 | 0 |
| Idaho | 17 | 102 | 119 | 230 |
| *Illinois | 0 | 0 | 0 | 0 |
| Indiana | 434 | 283 | 717 | 1,000 |
| *Iowa | 0 | 0 | 0 | 0 |
| *Kansas | 0 | 0 | 0 | 0 |
| *Kentucky | 0 | 0 | 0 | 0 |
| *Louisiana | 0 | 0 | 0 | 0 |
| *Maine | 0 | 0 | 0 | 0 |
| *Maryland | 0 | 0 | 0 | 0 |
| *Massachusetts | 0 | 0 | 0 | 0 |
| *Michigan | 0 | 0 | 0 | 0 |
| Minnesota | 61 | 61 | 122 | 183 |
| *Mississippi | 0 | 0 | 0 | 0 |
| *Missouri | 0 | 0 | 0 | 0 |
| *Montana | 0 | 0 | 0 | 0 |
| *Nebraska | 0 | 0 | 0 | 0 |
| *Nevada | 0 | 0 | 0 | 0 |
| *New Hampshire | 0 | 0 | 0 | 0 |
| *New Jersey | 0 | 0 | 0 | 0 |
| *New Mexico | 0 | 0 | 0 | 0 |
| *New York | 0 | 0 | 0 | 0 |
| North Carolina | 145 | 181 | 326 | 508 |
| *North Dakota | 0 | 0 | 0 | 0 |
| *Ohio | 0 | 0 | 0 | 0 |
| *Oklahoma | 0 | 0 | 0 | 0 |
| Oregon | 22 | 216 | 238 | 465 |
| Pennsylvania | 153 | 255 | 408 | 663 |
| *Rhode Island | 0 | 0 | 0 | 0 |
| *South Carolina | 0 | 0 | 0 | 0 |
| *South Dakota | 0 | 0 | 0 | 0 |
| Tennessee | 455 | 622 | 1,077 | 1,700 |
| Texas | 1,015 | 810 | 1,825 | 2,645 |
| *Utah | 0 | 0 | 0 | 0 |
| *Vermont | 0 | 0 | 0 | 0 |
| *Virginia | 0 | 0 | 0 | 0 |
| *Washington | 0 | 0 | 0 | 0 |
| *West Virginia | 0 | 0 | 0 | 0 |
| *Wisconsin | 0 | 0 | 0 | 0 |
| *Wyoming | 0 | 0 | 0 | 0 |
| *Canada | 0 | 0 | 0 | 0 |
| *Puerto Rico | 0 | 0 | 0 | 0 |
| Total | 3,498 | 4,552 | 8,050 | 12,657 |
| (*) THESE STATES HAVE FEWER THAN THREE PLANTS. | ||||
| FIGURES ARE AGGREGATED ON FIRST LINE ABOVE | ||||
| TOTALS TO PROTECT PROPRIETARY INFORMATION. | ||||
| Institute for Building Technology & Safety |
| Shipments and Production Summary Report |
06/01/2022 – 06/30/2022
| Shipments | ||||
| State | SW | MW | Total | Floors |
| Dest. Pending | 3 | 6 | 9 | 15 |
| Alabama | 794 | 291 | 1,085 | 1,377 |
| Alaska | 1 | 1 | 2 | 3 |
| Arizona | 43 | 201 | 244 | 448 |
| Arkansas | 64 | 102 | 166 | 268 |
| California | 66 | 314 | 380 | 710 |
| Colorado | 30 | 75 | 105 | 180 |
| Connecticut | 4 | 2 | 6 | 8 |
| Delaware | 5 | 20 | 25 | 45 |
| District of Columbia | 0 | 0 | 0 | 0 |
| Florida | 263 | 633 | 896 | 1,535 |
| Georgia | 151 | 270 | 421 | 693 |
| Hawaii | 0 | 0 | 0 | 0 |
| Idaho | 7 | 48 | 55 | 107 |
| Illinois | 81 | 44 | 125 | 169 |
| Indiana | 148 | 72 | 220 | 292 |
| Iowa | 50 | 12 | 62 | 74 |
| Kansas | 43 | 21 | 64 | 85 |
| Kentucky | 103 | 228 | 331 | 559 |
| Louisiana | 315 | 187 | 502 | 690 |
| Maine | 33 | 47 | 80 | 127 |
| Maryland | 54 | 15 | 69 | 84 |
| Massachusetts | 5 | 8 | 13 | 21 |
| Michigan | 238 | 227 | 465 | 692 |
| Minnesota | 20 | 49 | 69 | 118 |
| Mississippi | 154 | 171 | 325 | 496 |
| Missouri | 52 | 88 | 140 | 228 |
| Montana | 8 | 37 | 45 | 82 |
| Nebraska | 19 | 5 | 24 | 29 |
| Nevada | 5 | 49 | 54 | 106 |
| New Hampshire | 18 | 23 | 41 | 64 |
| New Jersey | 29 | 20 | 49 | 69 |
| New Mexico | 93 | 78 | 171 | 249 |
| New York | 96 | 139 | 235 | 374 |
| North Carolina | 291 | 258 | 549 | 807 |
| North Dakota | 12 | 17 | 29 | 46 |
| Ohio | 144 | 64 | 208 | 272 |
| Oklahoma | 150 | 82 | 232 | 314 |
| Oregon | 16 | 133 | 149 | 289 |
| Pennsylvania | 81 | 121 | 202 | 322 |
| Rhode Island | 0 | 0 | 0 | 0 |
| South Carolina | 194 | 286 | 480 | 769 |
| South Dakota | 17 | 13 | 30 | 43 |
| Tennessee | 133 | 245 | 378 | 623 |
| Texas | 1,015 | 1,083 | 2,098 | 3,197 |
| Utah | 5 | 20 | 25 | 45 |
| Vermont | 4 | 10 | 14 | 24 |
| Virginia | 59 | 57 | 116 | 173 |
| Washington | 8 | 165 | 173 | 345 |
| West Virginia | 33 | 77 | 110 | 187 |
| Wisconsin | 57 | 26 | 83 | 109 |
| Wyoming | 14 | 5 | 19 | 24 |
| Canada | 0 | 0 | 0 | 0 |
| Puerto Rico | 0 | 0 | 0 | 0 |
| Total | 5,228 | 6,145 | 11,373 | 17,586 |
| THE ABOVE STATISTICS ARE PROVIDED AS A MONTHLY | ||||
| SUBSCRIPTION SERVICE. REPRODUCTION IN PART OR | ||||
| IN TOTAL MUST CARRY AN ATTRIBUTION TO IBTS, INC. | ||||
| Production | ||||
| State | SW | MW | Total | Floors |
| States Shown(*) | 538 | 445 | 983 | 1,432 |
| Alabama | 1,016 | 857 | 1,873 | 2,730 |
| *Alaska | 0 | 0 | 0 | 0 |
| Arizona | 33 | 219 | 252 | 475 |
| *Arkansas | 0 | 0 | 0 | 0 |
| California | 41 | 273 | 314 | 596 |
| *Colorado | 0 | 0 | 0 | 0 |
| *Connecticut | 0 | 0 | 0 | 0 |
| *Delaware | 0 | 0 | 0 | 0 |
| *District of Columbia | 0 | 0 | 0 | 0 |
| Florida | 132 | 280 | 412 | 696 |
| Georgia | 287 | 492 | 779 | 1,276 |
| *Hawaii | 0 | 0 | 0 | 0 |
| Idaho | 27 | 131 | 158 | 296 |
| *Illinois | 0 | 0 | 0 | 0 |
| Indiana | 618 | 347 | 965 | 1,312 |
| *Iowa | 0 | 0 | 0 | 0 |
| *Kansas | 0 | 0 | 0 | 0 |
| *Kentucky | 0 | 0 | 0 | 0 |
| *Louisiana | 0 | 0 | 0 | 0 |
| *Maine | 0 | 0 | 0 | 0 |
| *Maryland | 0 | 0 | 0 | 0 |
| *Massachusetts | 0 | 0 | 0 | 0 |
| *Michigan | 0 | 0 | 0 | 0 |
| Minnesota | 107 | 83 | 190 | 273 |
| *Mississippi | 0 | 0 | 0 | 0 |
| *Missouri | 0 | 0 | 0 | 0 |
| *Montana | 0 | 0 | 0 | 0 |
| *Nebraska | 0 | 0 | 0 | 0 |
| *Nevada | 0 | 0 | 0 | 0 |
| *New Hampshire | 0 | 0 | 0 | 0 |
| *New Jersey | 0 | 0 | 0 | 0 |
| *New Mexico | 0 | 0 | 0 | 0 |
| *New York | 0 | 0 | 0 | 0 |
| North Carolina | 190 | 273 | 463 | 739 |
| *North Dakota | 0 | 0 | 0 | 0 |
| *Ohio | 0 | 0 | 0 | 0 |
| *Oklahoma | 0 | 0 | 0 | 0 |
| Oregon | 25 | 285 | 310 | 611 |
| Pennsylvania | 220 | 394 | 614 | 1,007 |
| *Rhode Island | 0 | 0 | 0 | 0 |
| *South Carolina | 0 | 0 | 0 | 0 |
| *South Dakota | 0 | 0 | 0 | 0 |
| Tennessee | 653 | 865 | 1,518 | 2,384 |
| Texas | 1,341 | 1,201 | 2,542 | 3,759 |
| *Utah | 0 | 0 | 0 | 0 |
| *Vermont | 0 | 0 | 0 | 0 |
| *Virginia | 0 | 0 | 0 | 0 |
| *Washington | 0 | 0 | 0 | 0 |
| *West Virginia | 0 | 0 | 0 | 0 |
| *Wisconsin | 0 | 0 | 0 | 0 |
| *Wyoming | 0 | 0 | 0 | 0 |
| *Canada | 0 | 0 | 0 | 0 |
| *Puerto Rico | 0 | 0 | 0 | 0 |
| Total | 5,228 | 6,145 | 11,373 | 17,586 |
| (*) THESE STATES HAVE FEWER THAN THREE PLANTS. | ||||
| FIGURES ARE AGGREGATED ON FIRST LINE ABOVE | ||||
| TOTALS TO PROTECT PROPRIETARY INFORMATION. | ||||
Cutting and pasting the data from the state of Texas, which is the top producing manufactured housing state in the U.S. and is also number one for new HUD Code manufactured home shipments reveals this snapshot.
| Shipments |
|
||||
| SS | MS | Floors | Total | ||
| Texas | 1,015 | 1,083 | 2,098 | 3,197 | June |
| Texas | 728 | 738 | 1,466 | 2,214 | July |
| Texas | 998 | 858 | 1,856 | 2,729 | August |
| Production | |||||
| SS | MS | Floors | Total | ||
| Texas | 1,341 | 1,201 | 2,542 | 3,759 | June |
| Texas | 1,015 | 810 | 1,825 | 2,645 | July |
| Texas | 1,453 | 995 | 2,448 | 3,457 | August |
So, the ‘official’ HUD data month-over-month for manufactured home production and shipments dipped in July but rebounded in August.
Single section (SS) manufactured homes dominated in production all three months shown.
But shipments of manufactured homes within or into Texas reveals fewer manufactured homes are occurring relative to production in Texas.
There is more unpacked this week.

Make sure you see the postscript for today on a relevant goal and solution-oriented topic.
With no further adieu, here are the headlines for what we and others lovingly call MHVille from 10.2 to 10.9.2022.
What’s New on MHLivingNews

What’s New from Washington, D.C. from MHARR
Manufactured Home Industry Production Continues to Grow Year Over Year in August 2022
What’s New on the Words of Wisdom by Tim Connor, CSP

What’s New on the Masthead Editorial Blog
What’s New on the first and still only MHVille Daily Business News on MHProNews
Saturday 10.8.2022
Friday 10.7.2022
Thursday 10.6.2022
Wednesday 10.5.2022
Tuesday 10.4.2022
Monday 10.3.2022
Sunday 10.2.2022
Postscript
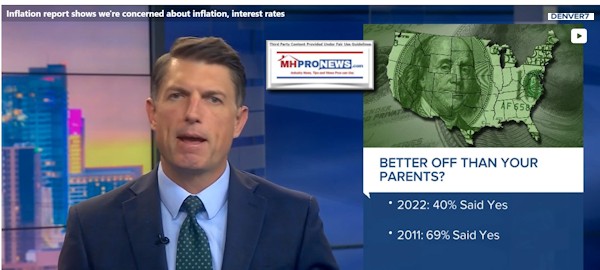
From Denver 7 via Rumble is the following video.
That video was embedded on an MSN article that had MarketWatch as its source. The title of that article was “Inflation is going to fall just as fast as it rose, and that’s investors’ cue to enter the stock market.” It was labeled as “opinion,” was last updated on 10.8.2022 and was submitted by Michael Brush.
Said Brush, “Before you laugh this off, consider the logic. It is not completely absurd.”
- Pardon me, but perhaps Brush is looking to replace Karine Jean-Pierre as the Biden White House Press Secretary?
- Or is Brush looking for a similar role with the Democratic National Committee?
Arguably, no twisted “logic” – so called – can reverse the facts.
The facts are that while several factors interlace that contribute to the Biden era inflation, inflation under President Donald J. Trump was tame by comparison. Yes, higher fuel costs under Biden contribute to inflation, as do other policy-driven factors. But honest economists say inflation is caused by the inflating of the money supply. By inflating the money supply in the U.S. at seemingly record rates, the value of all ‘dollars’ has been diminished.
Inflation, so called, could thus be described as a reduction in the purchasing price of the dollar.
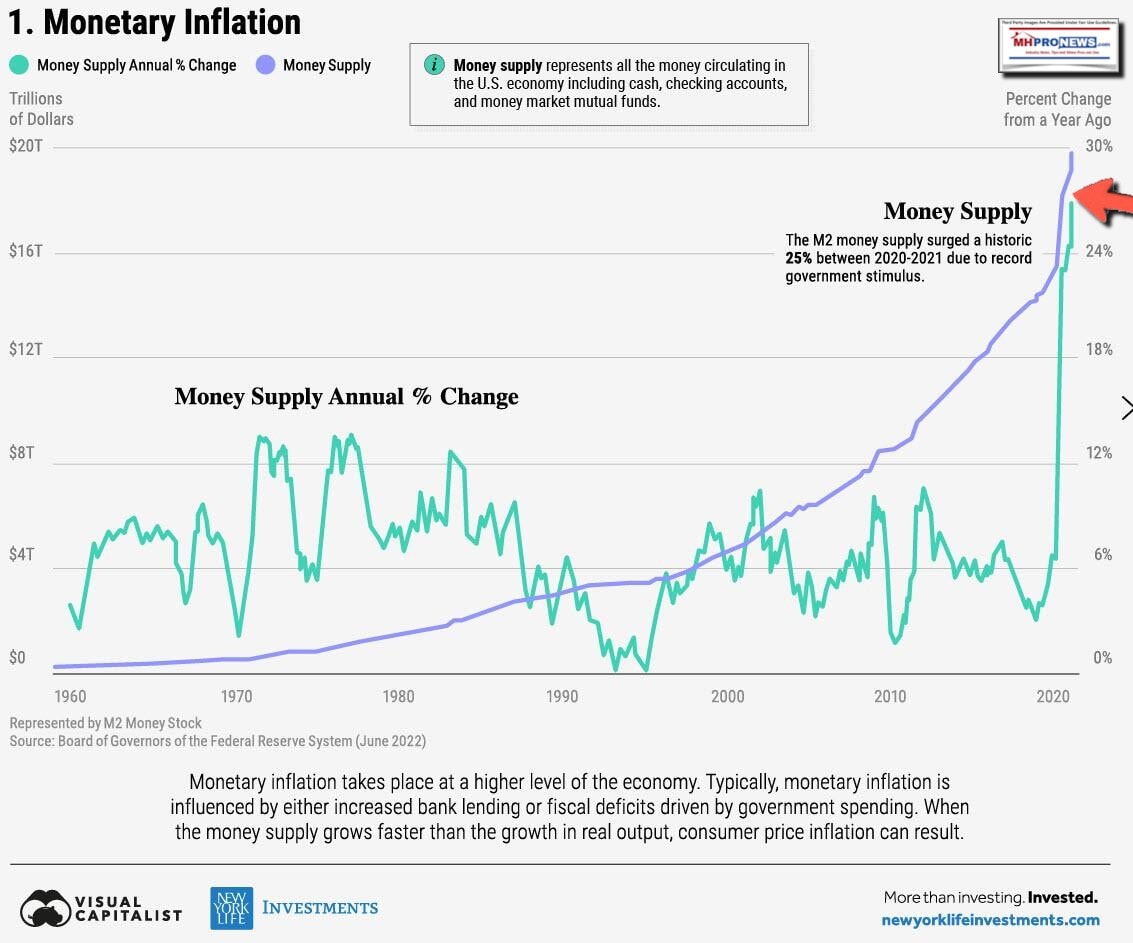

The paltering, projecting, and posturing done in the last some 20 months by Biden and his team could well be a study in Orwellian Newspeak.
Tim Connor, in his non-political article linked above opened with these words in a context of career and professional advice: “Life happens at the level of action, not words.” Alfred Adler. I wonder if any politicians are familiar with this quote? Probably not. …”
Biden promised to unite the nation. But oddly, the unity that has been forthcoming has been unity against his policies and that of his party’s Democratically controlled Congress and bureaucracy.
Biden promised to “Build Back Better.”
- But what has emerged is a nation that has seen record supply chain disruptions.
- Affordable housing is growing rarer day by day.
- As interest rates combined with higher housing costs than 2 years ago, payments on the purchase of a new home are “pricing out” millions of Americans.
- Energy and fuel costs, which drive other costs higher, was exacerbated by cutting off the Keystone Pipeline and a host of policy decisions that surprised domestic energy production. It should be obvious that investors and businesses engaged in U.S. energy production, drilling, etc. are bound to cut back until a more business and non-green policy is put in place by some future – presumably Republican – administration.
As the midterms approach, the importance of this WND op-ed and the reasons why people of all political (or non-political) backgrounds to go and vote the party in power out in the looming 2020 midterms grow. Check it out.

There is always more to say, but that is sufficient for today. ###

need to wait years for legislation that in the past has often led to little or no discernable benefit. https://www.wnd.com/2021/05/solution-big-tech-oligarchs/


Again, our thanks to free email subscribers and all readers like you, our tipsters/sources, sponsors and God for making and keeping us the runaway number one source for authentic “News through the lens of manufactured homes and factory-built housing” © where “We Provide, You Decide.” © ## (Affordable housing, manufactured homes, reports, fact-checks, analysis, and commentary. Third-party images or content are provided under fair use guidelines for media.) (See Related Reports, further below. Text/image boxes often are hot-linked to other reports that can be access by clicking on them.)

By L.A. “Tony” Kovach – for MHProNews.com.
Tony earned a journalism scholarship and earned numerous awards in history and in manufactured housing.
For example, he earned the prestigious Lottinville Award in history from the University of Oklahoma, where he studied history and business management. He’s a managing member and co-founder of LifeStyle Factory Homes, LLC, the parent company to MHProNews, and MHLivingNews.com.
This article reflects the LLC’s and/or the writer’s position, and may or may not reflect the views of sponsors or supporters.
Connect on LinkedIn: http://www.linkedin.com/in/latonykovach
Related References:
The text/image boxes below are linked to other reports, which can be accessed by clicking on them.


