
IBISWorld stated in the pitch for their recent 2024 report that as: “traditional house prices soared, making affordable manufactured homes a more attractive proposition. Still, the industry has also been undergoing consolidation as less-profitable dealers either exited the market or merged with larger players, intensifying market concentration.” MHProNews has reported on IBISWorld before, see the report linked here and a reference yesterday found among the headlines for the week in review that follow. Kevin Clayton, in testimony to Congress, said that thousands of manufactured home retailers have shuttered, along with scores of factories and hundreds of thousands of jobs lost as a result. MHProNews has been reporting on controversies related to the steady consolidation or oligopoly style monopolization of manufactured housing for years. Major media outlets have written about the monopolization of America, including the left-leaning New York Times column by David Leonhardt-“The Monopolization of America,” Manufactured Housing Slant in a 2018 report. The Biden-Harris Administration White House website announced this as an executive order level concern. Yet, Kamala Harris’ campaign, per a report on 7.26.2024 by Reuters is accepting money from billionaire Democratic donors who have publicly said they want Harris to terminate antitrust enforcer Lina Khan, who was appointed by the Biden regime. Per Reuters: “Billionaire Democratic donors Barry Diller and Reid Hoffman said in interviews this week they hope Kamala Harris will replace Federal Trade Commission Chair Lina Khan if she becomes U.S. president, openly rejecting a pillar of President Joe Biden’s antitrust policy.” Reuters also said: “Khan has been at the forefront of the Biden administration’s push to use U.S. antitrust law to boost competition and address high prices and low wages.”
More on that pattern in reports linked for the headlines for the week in review, but next let’s pivot to other headline topic, which is more new manufactured home data according to HUD’s contractor and the U.S. Census Bureau.
The Institute for Building Technology & Safety (IBTS) collects data under contract for the U.S. Department of Housing and Urban Development (HUD), so the figures that follow are ‘official’ statistics. SW is an abbreviation for ‘single wide’ manufactured homes, but more appropriately called single section manufactured homes. MW is an abbreviation for “multi-wide” or multi-sectional manufactured homes. These are typically two floors, but sometimes might be 3 or 4 floors in configuration, which could be determined by doing the math using the floor count and MW data.
Part I
| Institute for Building Technology & Safety | |||||||||
| Shipments and Production Summary Report 5/01/2024 – 5/31/2024 |
| Shipments | ||||
| State | SW | MW | Total | Floors |
| Dest. Pending | 8 | 6 | 14 | 20 |
| Alabama | 279 | 247 | 526 | 777 |
| Alaska | 3 | 8 | 11 | 19 |
| Arizona | 53 | 142 | 195 | 336 |
| Arkansas | 69 | 97 | 166 | 263 |
| California | 51 | 186 | 237 | 430 |
| Colorado | 61 | 47 | 108 | 155 |
| Connecticut | 8 | 1 | 9 | 10 |
| Delaware | 7 | 24 | 31 | 55 |
| District of Columbia | 0 | 0 | 0 | 0 |
| Florida | 266 | 480 | 746 | 1,228 |
| Georgia | 125 | 251 | 376 | 628 |
| Hawaii | 0 | 0 | 0 | 0 |
| Idaho | 10 | 28 | 38 | 67 |
| Illinois | 52 | 35 | 87 | 122 |
| Indiana | 138 | 51 | 189 | 240 |
| Iowa | 8 | 11 | 19 | 30 |
| Kansas | 36 | 8 | 44 | 52 |
| Kentucky | 128 | 220 | 348 | 567 |
| Louisiana | 330 | 152 | 482 | 634 |
| Maine | 29 | 37 | 66 | 103 |
| Maryland | 7 | 6 | 13 | 19 |
| Massachusetts | 11 | 10 | 21 | 31 |
| Michigan | 171 | 154 | 325 | 479 |
| Minnesota | 28 | 25 | 53 | 78 |
| Mississippi | 176 | 184 | 360 | 546 |
| Missouri | 76 | 86 | 162 | 248 |
| Montana | 14 | 19 | 33 | 53 |
| Nebraska | 12 | 2 | 14 | 16 |
| Nevada | 6 | 34 | 40 | 74 |
| New Hampshire | 12 | 19 | 31 | 50 |
| New Jersey | 20 | 8 | 28 | 36 |
| New Mexico | 57 | 91 | 148 | 240 |
| New York | 57 | 89 | 146 | 235 |
| North Carolina | 228 | 342 | 570 | 911 |
| North Dakota | 13 | 18 | 31 | 49 |
| Ohio | 85 | 54 | 139 | 193 |
| Oklahoma | 140 | 110 | 250 | 360 |
| Oregon | 52 | 90 | 142 | 233 |
| Pennsylvania | 67 | 77 | 144 | 221 |
| Rhode Island | 4 | 3 | 7 | 10 |
| South Carolina | 180 | 298 | 478 | 777 |
| South Dakota | 30 | 16 | 46 | 62 |
| Tennessee | 111 | 261 | 372 | 633 |
| Texas | 679 | 943 | 1,622 | 2,572 |
| Utah | 5 | 15 | 20 | 35 |
| Vermont | 9 | 10 | 19 | 29 |
| Virginia | 49 | 67 | 116 | 184 |
| Washington | 11 | 102 | 113 | 220 |
| West Virginia | 36 | 69 | 105 | 174 |
| Wisconsin | 116 | 34 | 150 | 184 |
| Wyoming | 11 | 7 | 18 | 25 |
| Canada | 0 | 0 | 0 | 0 |
| Puerto Rico | 0 | 0 | 0 | 0 |
| Total | 4,134 | 5,274 | 9,408 | 14,713 |
| THE ABOVE STATISTICS ARE PROVIDED AS A MONTHLY | ||||
| SUBSCRIPTION SERVICE. REPRODUCTION IN PART OR | ||||
| IN TOTAL MUST CARRY AN ATTRIBUTION TO IBTS, INC. | 0 | |||
| Production | ||||
| State | SW | MW | Total | Floors |
| States Shown(*) | 245 | 312 | 557 | 870 |
| Alabama | 758 | 845 | 1,603 | 2,455 |
| *Alaska | 0 | 0 | 0 | 0 |
| Arizona | 63 | 162 | 225 | 387 |
| *Arkansas | 0 | 0 | 0 | 0 |
| California | 52 | 176 | 228 | 409 |
| *Colorado | 0 | 0 | 0 | 0 |
| *Connecticut | 0 | 0 | 0 | 0 |
| *Delaware | 0 | 0 | 0 | 0 |
| *District of Columbia | 0 | 0 | 0 | 0 |
| Florida | 77 | 248 | 325 | 575 |
| Georgia | 191 | 405 | 596 | 1,003 |
| *Hawaii | 0 | 0 | 0 | 0 |
| Idaho | 28 | 75 | 103 | 181 |
| *Illinois | 0 | 0 | 0 | 0 |
| Indiana | 546 | 257 | 803 | 1,060 |
| *Iowa | 0 | 0 | 0 | 0 |
| *Kansas | 0 | 0 | 0 | 0 |
| *Kentucky | 0 | 0 | 0 | 0 |
| *Louisiana | 0 | 0 | 0 | 0 |
| *Maine | 0 | 0 | 0 | 0 |
| *Maryland | 0 | 0 | 0 | 0 |
| *Massachusetts | 0 | 0 | 0 | 0 |
| *Michigan | 0 | 0 | 0 | 0 |
| Minnesota | 55 | 60 | 115 | 175 |
| *Mississippi | 0 | 0 | 0 | 0 |
| *Missouri | 0 | 0 | 0 | 0 |
| *Montana | 0 | 0 | 0 | 0 |
| *Nebraska | 0 | 0 | 0 | 0 |
| *Nevada | 0 | 0 | 0 | 0 |
| *New Hampshire | 0 | 0 | 0 | 0 |
| *New Jersey | 0 | 0 | 0 | 0 |
| *New Mexico | 0 | 0 | 0 | 0 |
| *New York | 0 | 0 | 0 | 0 |
| North Carolina | 216 | 345 | 561 | 906 |
| *North Dakota | 0 | 0 | 0 | 0 |
| *Ohio | 46 | 59 | 105 | 164 |
| *Oklahoma | 0 | 0 | 0 | 0 |
| Oregon | 44 | 191 | 235 | 432 |
| Pennsylvania | 217 | 256 | 473 | 729 |
| *Rhode Island | 0 | 0 | 0 | 0 |
| *South Carolina | 0 | 0 | 0 | 0 |
| *South Dakota | 0 | 0 | 0 | 0 |
| Tennessee | 582 | 840 | 1,422 | 2,262 |
| Texas | 1,014 | 1,043 | 2,057 | 3,105 |
| *Utah | 0 | 0 | 0 | 0 |
| *Vermont | 0 | 0 | 0 | 0 |
| *Virginia | 0 | 0 | 0 | 0 |
| *Washington | 0 | 0 | 0 | 0 |
| *West Virginia | 0 | 0 | 0 | 0 |
| *Wisconsin | 0 | 0 | 0 | 0 |
| *Wyoming | 0 | 0 | 0 | 0 |
| *Canada | 0 | 0 | 0 | 0 |
| *Puerto Rico | 0 | 0 | 0 | 0 |
| Total | 4,134 | 5,274 | 9,408 | 14,713 |
| (*) THESE STATES HAVE FEWER THAN THREE PLANTS. | ||||
| FIGURES ARE AGGREGATED ON FIRST LINE ABOVE | ||||
| TOTALS TO PROTECT PROPRIETARY INFORMATION. | ||||
| Ashok K Goswami, PE, COO, 45207 Research Place, Ashburn, VA |
Part II – New Manufactured Housing Information According to data compiled and published by the U.S. Census Bureau
Average Sales Price of New Manufactured Homes by Region and Size of Home |
|||||||||||||||
By Month of Shipment |
|||||||||||||||
| (Dollars) | |||||||||||||||
Note: data for the Midwest South and West regions of the U.S. by month and year per the Census Bureau follows.
| United States | Northeast | |||||
| Total1 | Single | Double | Total1 | Single | Double | |
| 2024 | ||||||
| February | 121,600 | 80,200 | 152,400 | 121,400 | 86,200 | 147,800 |
| January | 119,200 | 78,900 | 148,100 | 117,900 | 88,700 | 142,400 |
| 2023 | ||||||
| December | 121,300 | 79,600 | 149,600 | 124,100 | 83,500 | 156,600 |
| November | 126,600 | 85,900 | 154,100 | 122,600 | 92,400 | 158,200 |
| October | 120,000 | 83,300 | 147,700 | 118,900 | 84,300 | 151,900 |
| September | 119,700 | 80,400 | 151,700 | 128,700 | 85,400 | 172,800 |
| August | 128,800 | 89,800 | 154,600 | 132,500 | 105,200 | 158,400 |
| July | 118,000 | 82,300 | 150,200 | 122,700 | 72,900 | 143,100 |
| June | 121,400 | 85,400 | 153,900 | 121,800 | 85,300 | 149,800 |
| May | 129,900 | 86,300 | 160,200 | 120,900 | 89,800 | 146,000 |
| April | 125,000 | 86,100 | 153,600 | 123,900 | 87,000 | 160,800 |
| March | 124,700 | 85,200 | 155,400 | 135,200 | 100,600 | 172,900 |
| February | 128,100 | 89,200 | 160,400 | 136,600 | 107,000 | 167,800 |
| January | 126,100 | 82,100 | 156,900 | 122,900 | 86,700 | 148,300 |
| 2022 | ||||||
| December | 122,100 | 80,200 | 155,700 | 113,900 | 75,300 | 158,300 |
| November | 125,200 | 88,000 | 155,200 | 119,200 | 93,900 | 146,700 |
| October | 128,300 | 81,400 | 160,400 | 127,000 | 86,400 | 155,300 |
| September | 130,400 | 95,800 | 159,400 | 131,300 | 101,400 | 162,000 |
| August | 125,700 | 86,500 | 158,800 | 117,800 | 74,700 | 145,100 |
| July | 131,800 | 85,200 | 161,600 | 129,700 | 93,300 | 157,400 |
| June | 126,900 | 87,600 | 159,600 | 118,500 | 92,700 | 134,100 |
| May | 124,900 | 85,800 | 159,200 | 121,500 | 82,100 | 148,500 |
| April | 132,000 | 83,100 | 168,000 | 128,900 | 87,200 | 154,700 |
| March | 129,200 | 87,300 | 156,600 | 117,900 | 97,400 | 145,300 |
| February | 128,000 | 87,700 | 156,300 | 130,600 | 76,000 | 152,700 |
| January | 122,500 | 84,600 | 152,800 | 120,600 | 85,900 | 141,800 |
| 2021 | ||||||
| December | 123,200 | 80,900 | 150,300 | 104,700 | 73,900 | 127,200 |
| November | 111,900 | 76,400 | 139,900 | 100,900 | 71,600 | 133,500 |
| October | 112,000 | 81,700 | 138,200 | 110,300 | 74,400 | 138,700 |
| September | 118,300 | 78,800 | 141,300 | 102,100 | 76,100 | 124,100 |
| August | 112,000 | 80,000 | 138,000 | 105,000 | 86,000 | 117,000 |
| July | 118,700 | 76,000 | 137,800 | 98,500 | 74,100 | 125,700 |
| June | 106,800 | 70,200 | 128,100 | 101,600 | 73,700 | 124,200 |
| May | 106,500 | 69,900 | 128,300 | 98,400 | 69,900 | 121,500 |
| April | 100,200 | 66,700 | 122,500 | 95,900 | 73,800 | 113,300 |
| March | 98,100 | 63,300 | 123,200 | 91,400 | 58,600 | 121,300 |
| February | 98,300 | 65,400 | 122,500 | 88,300 | 59,400 | 113,800 |
| January | 95,000 | 64,100 | 118,500 | 102,600 | 67,900 | 116,200 |
| 2020 | ||||||
| December | 90,200 | 62,600 | 110,800 | 93,600 | 58,200 | 115,300 |
| November | 92,600 | 63,500 | 112,800 | 85,600 | 63,600 | 103,900 |
| October | 89,400 | 57,200 | 110,000 | 91,000 | 57,700 | 112,100 |
| September | 87,300 | 58,300 | 107,800 | 84,800 | 61,000 | 105,600 |
| August | 88,200 | 57,700 | 109,300 | 87,600 | 56,700 | 109,600 |
| July | 84,200 | 59,800 | 102,700 | 78,600 | 58,600 | 100,300 |
| June | 85,600 | 52,900 | 109,800 | 91,700 | 55,400 | 117,000 |
| May | 85,900 | 55,200 | 109,100 | 79,100 | 56,300 | 100,200 |
| April | 86,900 | 53,300 | 108,200 | 86,100 | 53,900 | 105,200 |
| March | 82,900 | 53,800 | 106,900 | 79,100 | 54,400 | 102,400 |
| February | 83,400 | 55,600 | 107,500 | 81,500 | 54,000 | 109,800 |
| January | 86,400 | 55,300 | 107,900 | 77,700 | 52,900 | 104,800 |
| 2019 | ||||||
| December | 86,400 | 54,400 | 105,700 | 79,500 | 54,000 | 98,500 |
| November | 81,600 | 52,100 | 107,100 | 79,200 | 49,400 | 113,100 |
| October | 81,700 | 53,900 | 103,800 | 80,600 | 61,200 | 101,600 |
| September | 81,500 | 55,600 | 101,800 | 84,100 | 59,600 | 103,700 |
| August | 84,100 | 49,200 | 107,900 | 81,900 | 45,700 | 101,200 |
| July | 82,000 | 54,000 | 106,500 | 88,000 | 51,600 | 129,500 |
| June | 84,400 | 52,800 | 103,800 | 84,800 | 57,800 | 109,100 |
| May | 78,100 | 53,800 | 98,100 | 76,400 | 49,200 | 105,200 |
| April | 78,900 | 55,700 | 100,700 | 82,000 | 59,300 | 109,000 |
| March | 78,900 | 50,400 | 102,100 | 74,500 | 48,000 | 98,400 |
| February | 85,000 | 52,600 | 107,600 | 74,100 | 52,300 | 97,500 |
| January | 81,800 | 53,400 | 103,400 | 86,600 | 60,100 | 109,000 |
| 2018 | ||||||
| December | 82,400 | 52,100 | 106,000 | 79,600 | 57,500 | 93,600 |
| November | 79,900 | 55,400 | 100,500 | 81,400 | 52,300 | 104,700 |
| October | 82,400 | 54,500 | 106,000 | 81,600 | 59,300 | 96,200 |
| September | 83,600 | 54,400 | 105,400 | 78,800 | 57,600 | 97,300 |
| August | 81,500 | 55,100 | 100,900 | 82,900 | 58,400 | 113,000 |
| July | 78,900 | 52,000 | 99,300 | 73,600 | 33,900 | 100,600 |
| June | 85,400 | 54,900 | 101,300 | 82,400 | 52,900 | 97,500 |
| May | 81,200 | 57,100 | 99,100 | 81,700 | 62,400 | 104,300 |
| April | 74,900 | 50,600 | 98,700 | 87,300 | 54,900 | 109,900 |
| March | 70,600 | 49,800 | 91,400 | 70,900 | 50,400 | 96,600 |
| February | 73,400 | 47,900 | 93,800 | 80,400 | 50,800 | 98,200 |
| January | 69,000 | 47,300 | 92,100 | 79,500 | 52,400 | 106,000 |
| 2017 | ||||||
| December | 72,900 | 53,400 | 91,800 | 76,900 | 49,200 | 100,300 |
| November | 71,800 | 46,600 | 99,100 | 75,300 | 49,400 | 107,000 |
| October | 68,300 | 46,400 | 95,500 | 76,300 | 45,100 | 96,900 |
| September | 71,800 | 47,100 | 93,800 | 72,400 | 50,800 | 92,700 |
| August | 73,800 | 47,600 | 94,300 | 70,400 | 50,400 | 88,700 |
| July | 75,300 | 47,900 | 93,800 | 80,700 | 52,500 | 102,100 |
| June | 75,600 | 49,500 | 97,400 | 84,800 | 57,300 | 95,500 |
| May | 71,800 | 49,100 | 87,900 | 78,800 | 55,500 | 93,300 |
| April | 73,300 | 47,400 | 89,900 | 79,600 | 53,800 | 100,200 |
| March | 70,100 | 50,800 | 88,000 | 76,900 | 56,700 | 100,700 |
| February | 71,000 | 48,700 | 92,500 | 86,500 | 48,700 | 96,300 |
| January | 68,100 | 44,900 | 89,700 | 84,700 | 59,900 | 99,600 |
| 2016 | ||||||
| December | 73,100 | 49,900 | 90,800 | 73,900 | 44,200 | 92,800 |
| November | 71,700 | 47,000 | 90,900 | 70,800 | 45,500 | 94,000 |
| October | 71,600 | 48,300 | 87,400 | 75,300 | 45,700 | 90,700 |
| September | 69,400 | 46,700 | 93,000 | 79,600 | 55,400 | 101,800 |
| August | 74,200 | 50,000 | 93,100 | 86,100 | 57,500 | 106,600 |
| July | 73,300 | 49,500 | 91,000 | 73,900 | 53,400 | 103,600 |
| June | 70,500 | 46,600 | 87,000 | 85,000 | 50,900 | 113,700 |
| May | 71,300 | 45,800 | 87,800 | 75,900 | 45,900 | 99,600 |
| April | 67,800 | 44,100 | 87,500 | 78,600 | 45,400 | 100,100 |
| March | 69,800 | 44,500 | 88,300 | 72,800 | 45,100 | 103,200 |
| February | 67,600 | 43,900 | 92,600 | 81,500 | 50,000 | 97,300 |
| January | 67,600 | 45,900 | 84,100 | 69,400 | 48,100 | 90,700 |
| 2015 | ||||||
| December | 70,800 | 46,200 | 88,100 | 74,200 | 52,100 | 95,300 |
| November | 68,000 | 44,300 | 89,400 | 79,000 | 52,500 | 90,600 |
| October | 66,800 | 43,800 | 84,900 | 77,100 | 45,100 | 95,200 |
| September | 70,700 | 48,400 | 87,700 | 71,600 | 54,400 | 91,400 |
| August | 67,000 | 42,900 | 87,100 | 73,300 | 53,600 | 94,100 |
| July | 64,500 | 44,400 | 83,700 | 68,000 | 47,700 | 83,100 |
| June | 69,100 | 45,500 | 87,500 | 68,100 | 53,200 | 90,700 |
| May | 69,500 | 47,300 | 89,100 | 69,500 | 46,100 | 84,700 |
| April | 67,400 | 46,900 | 86,500 | 69,400 | 48,900 | 88,800 |
| March | 66,200 | 46,100 | 85,000 | 89,000 | 52,300 | 114,000 |
| February | 68,300 | 46,200 | 87,000 | 66,500 | 50,000 | 88,800 |
| January | 68,400 | 44,600 | 84,400 | 64,700 | 45,600 | 77,200 |
| 2014 | ||||||
| December | 64,800 | 46,200 | 78,100 | 68,100 | 55,300 | 77,500 |
| November | 64,200 | 43,700 | 83,500 | 80,500 | 58,000 | 98,300 |
| October | 62,400 | 46,000 | 76,900 | 63,400 | 50,900 | 73,600 |
| September | 67,000 | 43,600 | 82,600 | 71,900 | 45,000 | 88,500 |
| August | 67,100 | 44,200 | 87,600 | 71,700 | 43,100 | 93,600 |
| July | 63,500 | 45,400 | 80,100 | 57,900 | 43,900 | 73,300 |
| June | 65,200 | 44,900 | 84,000 | 73,800 | 47,000 | 94,900 |
| May | 65,400 | 45,700 | 78,300 | 62,900 | 50,200 | 76,200 |
| April | 66,400 | 44,700 | 83,000 | 61,300 | 44,000 | 82,500 |
| March | 65,700 | 43,200 | 83,900 | 76,400 | 43,100 | 91,600 |
| February | 64,300 | 45,000 | 82,200 | 59,100 | 40,600 | 76,200 |
| January | 68,300 | 48,000 | 84,500 | 72,100 | 48,700 | 92,600 |
| Midwest | South | West | |||||||
| Total1 | Single | Double | Total1 | Single | Double | Total1 | Single | Double | |
| 2024 | |||||||||
| February | 108,700 | 82,800 | 138,400 | 122,700 | 80,000 | 154,500 | 125,600 | 76,900 | 150,000 |
| January | 113,400 | 84,400 | 147,700 | 116,600 | 75,800 | 145,400 | 145,000 | 92,600 | 168,800 |
| 2023 | |||||||||
| December | 116,300 | 82,600 | 157,500 | 119,200 | 79,100 | 145,600 | 140,800 | 76,600 | 168,000 |
| November | 116,800 | 83,900 | 157,300 | 125,100 | 85,200 | 150,000 | 149,600 | 90,600 | 175,900 |
| October | 111,400 | 84,600 | 149,400 | 119,900 | 83,000 | 147,400 | 135,100 | 82,200 | 146,100 |
| September | 116,000 | 83,500 | 159,400 | 115,900 | 78,000 | 144,500 | 142,300 | 87,600 | 178,400 |
| August | 113,900 | 92,200 | 145,900 | 128,500 | 86,500 | 153,800 | 149,500 | 94,400 | 163,300 |
| July | 116,000 | 81,400 | 153,400 | 114,900 | 82,600 | 149,300 | 137,000 | 84,800 | 154,900 |
| June | 111,800 | 84,200 | 153,700 | 120,100 | 85,300 | 152,600 | 140,000 | 89,500 | 162,400 |
| May | 104,900 | 82,900 | 141,000 | 132,500 | 87,800 | 161,600 | 149,700 | 79,800 | 171,800 |
| April | 112,300 | 87,000 | 148,900 | 123,200 | 83,200 | 150,100 | 150,600 | 105,100 | 173,400 |
| March | 109,400 | 88,600 | 152,000 | 123,800 | 80,800 | 153,100 | 140,800 | 94,900 | 162,000 |
| February | 114,400 | 85,300 | 158,800 | 127,800 | 88,200 | 157,900 | 144,000 | 92,800 | 170,000 |
| January | 107,200 | 83,600 | 153,100 | 129,200 | 81,200 | 158,300 | 131,500 | 81,300 | 156,700 |
| 2022 | |||||||||
| December | 104,700 | 82,300 | 144,300 | 124,000 | 80,700 | 155,400 | 134,700 | 77,600 | 162,400 |
| November | 113,600 | 89,100 | 147,600 | 126,000 | 86,500 | 155,800 | 138,400 | 89,500 | 161,800 |
| October | 113,500 | 87,500 | 156,700 | 128,100 | 77,000 | 160,000 | 153,600 | 86,200 | 167,300 |
| September | 114,600 | 93,000 | 155,500 | 130,300 | 94,400 | 158,500 | 148,600 | 107,500 | 163,900 |
| August | 110,900 | 87,500 | 151,900 | 126,400 | 86,000 | 159,400 | 144,100 | 93,400 | 166,400 |
| July | 110,800 | 83,600 | 156,100 | 131,300 | 82,900 | 158,700 | 156,800 | 97,300 | 178,200 |
| June | 112,500 | 90,100 | 146,500 | 125,300 | 88,200 | 159,900 | 154,200 | 68,400 | 174,500 |
| May | 112,300 | 83,600 | 148,800 | 124,400 | 85,900 | 162,400 | 142,000 | 91,900 | 156,100 |
| April | 110,400 | 80,500 | 147,800 | 132,100 | 83,500 | 169,900 | 155,400 | 82,400 | 176,600 |
| March | 118,500 | 90,000 | 154,200 | 127,400 | 85,200 | 154,400 | 156,100 | 89,800 | 171,600 |
| February | 115,900 | 82,400 | 155,500 | 126,300 | 89,500 | 155,000 | 150,100 | 85,100 | 163,600 |
| January | 108,300 | 82,800 | 145,400 | 122,700 | 85,400 | 153,300 | 140,800 | 80,700 | 161,000 |
| 2021 | |||||||||
| December | 103,300 | 88,200 | 129,400 | 123,500 | 80,000 | 149,600 | 145,200 | 76,900 | 170,600 |
| November | 107,300 | 78,100 | 143,800 | 110,700 | 77,000 | 138,400 | 128,800 | 68,400 | 145,500 |
| October | 101,000 | 81,000 | 132,600 | 110,700 | 81,900 | 136,400 | 131,600 | 85,000 | 150,400 |
| September | 109,300 | 80,900 | 142,300 | 119,300 | 78,500 | 142,200 | 132,100 | 76,200 | 141,600 |
| August | 100,000 | 77,000 | 132,000 | 112,000 | 80,000 | 139,000 | 135,000 | 79,000 | 143,000 |
| July | 110,500 | 79,100 | 139,300 | 119,200 | 74,500 | 137,100 | 131,100 | 81,700 | 142,800 |
| June | 94,900 | 65,600 | 125,800 | 107,500 | 70,700 | 128,000 | 116,400 | 72,200 | 131,500 |
| May | 94,300 | 67,500 | 128,200 | 109,900 | 70,600 | 129,200 | 104,400 | 70,300 | 125,500 |
| April | 85,400 | 61,800 | 125,400 | 100,400 | 67,700 | 122,200 | 118,400 | 65,000 | 125,000 |
| March | 86,400 | 60,800 | 119,100 | 98,100 | 63,700 | 122,400 | 113,000 | 67,300 | 130,800 |
| February | 87,300 | 62,400 | 118,100 | 98,100 | 67,100 | 121,800 | 116,900 | 60,900 | 131,900 |
| January | 83,000 | 62,100 | 112,700 | 94,000 | 64,600 | 117,300 | 113,400 | 62,300 | 129,500 |
| 2020 | |||||||||
| December | 77,100 | 55,800 | 107,900 | 90,100 | 64,500 | 109,900 | 108,800 | 64,500 | 115,900 |
| November | 81,000 | 62,400 | 117,400 | 92,600 | 64,200 | 109,700 | 115,400 | 60,100 | 128,200 |
| October | 81,700 | 58,300 | 108,000 | 87,400 | 56,500 | 107,900 | 108,900 | 61,200 | 120,000 |
| September | 72,100 | 52,800 | 98,300 | 86,900 | 58,400 | 105,700 | 110,100 | 68,600 | 126,600 |
| August | 75,900 | 59,500 | 97,600 | 87,900 | 56,800 | 109,100 | 104,900 | 60,500 | 119,500 |
| July | 72,600 | 56,900 | 97,000 | 83,700 | 59,500 | 101,300 | 103,700 | 72,100 | 113,200 |
| June | 81,400 | 56,100 | 115,200 | 82,700 | 51,700 | 106,800 | 102,700 | 55,600 | 117,000 |
| May | 73,400 | 56,800 | 100,900 | 85,200 | 54,100 | 108,500 | 105,100 | 60,700 | 117,800 |
| April | 79,500 | 57,000 | 105,000 | 84,000 | 51,600 | 106,100 | 111,800 | 64,500 | 120,300 |
| March | 79,200 | 55,300 | 108,400 | 82,000 | 53,300 | 106,900 | 92,600 | 54,300 | 106,700 |
| February | 70,900 | 55,200 | 98,200 | 82,000 | 55,300 | 105,600 | 103,500 | 59,600 | 118,900 |
| January | 74,200 | 55,400 | 101,800 | 86,200 | 55,200 | 108,100 | 103,400 | 59,900 | 111,300 |
| 2019 | |||||||||
| December | 70,200 | 54,400 | 96,100 | 87,900 | 54,600 | 106,900 | 97,700 | 52,100 | 107,600 |
| November | 73,400 | 50,600 | 104,000 | 79,500 | 52,500 | 104,800 | 101,400 | 54,100 | 114,700 |
| October | 72,100 | 53,800 | 100,200 | 81,600 | 52,500 | 103,400 | 96,600 | 58,800 | 109,100 |
| September | 71,900 | 55,900 | 98,400 | 80,200 | 55,100 | 99,300 | 99,500 | 55,300 | 113,000 |
| August | 75,700 | 52,500 | 99,800 | 81,400 | 48,700 | 106,600 | 107,500 | 48,200 | 120,700 |
| July | 74,400 | 53,900 | 105,700 | 78,100 | 54,900 | 100,300 | 108,400 | 45,700 | 121,000 |
| June | 72,600 | 52,700 | 97,100 | 83,400 | 53,200 | 100,500 | 100,600 | 47,000 | 118,800 |
| May | 72,300 | 56,000 | 98,100 | 75,800 | 53,600 | 95,000 | 96,300 | 55,000 | 106,800 |
| April | 70,800 | 56,700 | 91,900 | 77,100 | 54,000 | 99,300 | 95,400 | 63,600 | 109,100 |
| March | 71,300 | 49,900 | 96,300 | 77,800 | 50,900 | 101,600 | 92,900 | 49,100 | 108,500 |
| February | 72,500 | 56,000 | 97,200 | 84,800 | 52,600 | 106,600 | 103,100 | 43,500 | 119,400 |
| January | 68,000 | 54,200 | 98,000 | 81,100 | 51,400 | 101,700 | 95,800 | 59,000 | 110,400 |
| 2018 | |||||||||
| December | 74,300 | 53,800 | 96,400 | 80,100 | 51,500 | 104,900 | 101,400 | 51,600 | 120,400 |
| November | 74,100 | 56,200 | 101,900 | 77,100 | 54,600 | 97,800 | 99,300 | 62,600 | 107,800 |
| October | 73,100 | 56,700 | 94,300 | 79,800 | 53,500 | 105,900 | 105,100 | 57,300 | 116,500 |
| September | 76,700 | 58,300 | 105,500 | 81,600 | 51,900 | 104,500 | 102,600 | 62,000 | 111,600 |
| August | 73,600 | 54,500 | 97,800 | 79,800 | 54,500 | 98,100 | 97,400 | 57,600 | 110,300 |
| July | 79,600 | 57,300 | 104,500 | 74,900 | 51,300 | 94,000 | 102,800 | 59,300 | 118,200 |
| June | 77,400 | 52,700 | 99,700 | 83,200 | 55,100 | 97,100 | 105,000 | 57,600 | 122,900 |
| May | 72,500 | 57,600 | 92,900 | 79,000 | 56,300 | 97,000 | 104,000 | 60,300 | 108,900 |
| April | 67,300 | 51,600 | 92,800 | 71,100 | 48,600 | 95,300 | 103,100 | 67,400 | 113,400 |
| March | 67,700 | 50,600 | 93,800 | 68,900 | 50,000 | 88,900 | 82,900 | 45,800 | 98,700 |
| February | 72,100 | 49,700 | 98,000 | 70,600 | 46,700 | 91,200 | 87,100 | 53,900 | 100,600 |
| January | 59,300 | 44,900 | 85,600 | 64,400 | 46,300 | 85,900 | 98,900 | 59,400 | 114,200 |
| 2017 | |||||||||
| December | 64,900 | 48,700 | 84,500 | 70,000 | 54,000 | 89,000 | 96,400 | 58,600 | 103,900 |
| November | 68,100 | 48,500 | 90,500 | 65,800 | 45,900 | 91,600 | 114,500 | 49,800 | 130,300 |
| October | 65,600 | 48,600 | 88,600 | 64,200 | 45,700 | 93,600 | 95,200 | 50,900 | 106,900 |
| September | 62,800 | 45,500 | 87,200 | 68,800 | 46,600 | 89,000 | 95,600 | 51,700 | 116,700 |
| August | 65,300 | 48,200 | 88,600 | 72,500 | 47,200 | 91,500 | 91,600 | 46,600 | 110,900 |
| July | 70,900 | 48,200 | 89,400 | 70,300 | 47,900 | 88,400 | 99,700 | 44,500 | 111,900 |
| June | 69,400 | 49,900 | 94,300 | 70,800 | 49,300 | 91,600 | 106,300 | 46,600 | 125,000 |
| May | 64,600 | 45,200 | 84,400 | 68,500 | 49,400 | 84,000 | 94,900 | 47,800 | 104,500 |
| April | 63,900 | 47,800 | 84,500 | 70,900 | 45,500 | 86,600 | 93,000 | 57,200 | 104,300 |
| March | 64,500 | 49,600 | 83,900 | 67,000 | 50,700 | 84,600 | 89,800 | 49,400 | 99,400 |
| February | 61,500 | 46,800 | 84,700 | 66,200 | 48,400 | 87,300 | 104,200 | 59,000 | 115,100 |
| January | 59,800 | 45,800 | 85,100 | 64,600 | 44,000 | 85,900 | 93,600 | 45,800 | 107,100 |
| 2016 | |||||||||
| December | 67,100 | 45,000 | 85,800 | 71,400 | 50,100 | 89,000 | 85,900 | 56,000 | 101,500 |
| November | 58,900 | 46,500 | 84,700 | 72,100 | 47,100 | 88,000 | 89,200 | 48,100 | 108,900 |
| October | 60,200 | 47,600 | 81,300 | 71,300 | 47,500 | 84,700 | 85,100 | 54,100 | 104,000 |
| September | 62,400 | 46,100 | 96,500 | 65,300 | 45,400 | 89,300 | 93,900 | 58,000 | 99,000 |
| August | 60,800 | 45,500 | 84,300 | 71,600 | 46,100 | 91,300 | 95,000 | 79,900 | 99,600 |
| July | 65,900 | 48,200 | 91,700 | 70,200 | 47,700 | 87,100 | 96,800 | 67,700 | 100,600 |
| June | 61,500 | 45,100 | 84,100 | 66,800 | 44,900 | 81,500 | 89,000 | 57,100 | 100,300 |
| May | 63,500 | 46,700 | 86,600 | 69,800 | 45,000 | 84,600 | 83,500 | 48,000 | 96,400 |
| April | 61,600 | 45,900 | 86,900 | 64,900 | 42,500 | 85,000 | 85,400 | 53,900 | 92,900 |
| March | 59,200 | 46,200 | 83,200 | 69,600 | 44,100 | 86,300 | 83,200 | 42,500 | 97,000 |
| February | 57,900 | 45,600 | 85,100 | 65,300 | 43,000 | 89,700 | 84,800 | 45,400 | 106,600 |
| January | 61,400 | 48,200 | 86,800 | 65,200 | 44,600 | 80,200 | 86,900 | 50,000 | 96,100 |
| 2015 | |||||||||
| December | 63,300 | 46,600 | 85,900 | 69,200 | 45,700 | 85,500 | 84,400 | 44,600 | 96,400 |
| November | 61,100 | 47,300 | 84,500 | 63,200 | 42,500 | 84,000 | 96,100 | 51,000 | 110,300 |
| October | 56,500 | 43,100 | 79,700 | 65,500 | 43,200 | 82,200 | 78,900 | 47,300 | 95,400 |
| September | 63,900 | 50,600 | 83,900 | 68,500 | 46,800 | 85,500 | 90,100 | 49,700 | 97,900 |
| August | 61,600 | 45,700 | 90,000 | 62,800 | 39,400 | 80,700 | 89,200 | 48,200 | 106,400 |
| July | 62,600 | 48,500 | 84,600 | 59,800 | 42,900 | 78,400 | 88,200 | 46,800 | 101,000 |
| June | 60,500 | 45,900 | 84,200 | 66,100 | 44,000 | 83,700 | 93,700 | 46,700 | 102,800 |
| May | 61,800 | 43,000 | 92,600 | 68,100 | 49,000 | 85,600 | 83,400 | 44,200 | 100,700 |
| April | 59,700 | 47,900 | 75,000 | 64,700 | 46,800 | 82,200 | 89,600 | 45,100 | 111,100 |
| March | 60,900 | 47,400 | 86,400 | 63,200 | 44,100 | 80,300 | 79,300 | 53,600 | 96,600 |
| February | 59,600 | 47,500 | 80,600 | 65,900 | 45,600 | 84,200 | 90,200 | 45,500 | 99,600 |
| January | 57,000 | 43,700 | 78,300 | 64,600 | 44,900 | 79,400 | 102,500 | 42,600 | 107,700 |
| 2014 | |||||||||
| December | 57,000 | 45,600 | 72,900 | 62,000 | 45,500 | 75,000 | 86,900 | 52,600 | 91,800 |
| November | 61,600 | 47,600 | 84,700 | 59,100 | 39,900 | 78,300 | 84,800 | 57,400 | 95,100 |
| October | 64,500 | 50,900 | 78,700 | 59,000 | 44,400 | 74,700 | 77,100 | 47,100 | 84,700 |
| September | 59,000 | 41,600 | 78,500 | 66,000 | 44,500 | 80,900 | 80,200 | 39,900 | 90,100 |
| August | 60,200 | 46,800 | 80,900 | 66,400 | 43,300 | 87,800 | 75,400 | 45,800 | 88,900 |
| July | 61,600 | 45,200 | 77,800 | 61,200 | 45,700 | 77,800 | 79,300 | 45,200 | 92,900 |
| June | 58,700 | 45,600 | 81,200 | 62,600 | 44,600 | 81,000 | 82,300 | 44,200 | 92,300 |
| May | 61,700 | 46,800 | 79,600 | 64,000 | 44,200 | 76,100 | 77,400 | 49,000 | 88,900 |
| April | 59,100 | 45,700 | 78,500 | 66,100 | 43,900 | 81,300 | 77,100 | 47,600 | 92,900 |
| March | 58,100 | 45,100 | 81,800 | 63,600 | 42,400 | 82,100 | 84,400 | 46,700 | 90,300 |
| February | 59,700 | 44,800 | 86,100 | 62,200 | 44,800 | 79,700 | 79,600 | 48,800 | 90,800 |
| January | 72,000 | 51,400 | 88,200 | 63,800 | 46,900 | 80,700 | 87,700 | 55,400 | 93,900 |
| 1 Includes manufactured homes with more than two sections. | ||||||||||
| Note: Estimates include manufactured homes that are sold and those intended for sale for residential use. | ||||||||||
| Note: The Census Bureau has reviewed this data product for unauthorized disclosure of confidential information and has approved | ||||||||||
| the disclosure avoidance practices applied. (Approval ID: CBDRB-FY24-0317) | ||||||||||
| Source: These data are produced by the U.S. Commerce Department’s Census Bureau from a survey sponsored by the | ||||||||||
| U.S. Department of Housing and Urban Development. | ||||||||||
Part III – Using Data from the National Association of Home Builders (NAHB) and Other Sources as Cited
1) Duncan Bates, President and CEO of Legacy Housing, has said that the biggest headwind that the manufactured home industry faces is placement. Bates-led Legacy Housing (LEGH) is a member of the Manufactured Housing Institute (MHI), per sources deemed reliable.
![DuncanBatesPhotoLegacyHousingLogoQuoteZoningBarriersLookBiggestHeadwindIinThisEntireIndustryIsWhereToPut[HUDCodeManufactured]HomesMHProNews](http://www.manufacturedhomepronews.com/wp-content/uploads/2023/11/DuncanBatesPhotoLegacyHousingLogoQuoteZoningBarriersLookBiggestHeadwindIinThisEntireIndustryIsWhereToPutHUDCodeManufacturedHomesMHProNews.jpg)
2) While still concerned about the pending DOE Energy Rule, the Manufactured Housing Association for Regulatory Reform (MHARR) has said similarly. MHARR stressed that the two biggest bottlenecks for manufactured housing include zoning/placement barriers and the need for more competitive financing. See that among the headlines for the week in review, further below.
3) Among the headlines for the week in review is a copy of the video featuring Warren Buffett saying that the Duty to Serve (DTS) manufactured housing’s implementation for chattel lending would lead to more manufactured homes sold. See that among the Masthead on MHProNews headlines.
4) Also found among the Daily Business News on MHProNews headlines is recent data from the National Association of Realtors (NAR) and also the following graphic from the National Association of Home Builders (NAHB).

5) With the above and following in mind, which updates information found here, consider the following math- and other evidence-supported insights.
- Using the Census Bureau provided data in Part II above, the national average cost for a new single-section manufactured home in February 2024 was about $80,200.
- Using the figures supplied by the NAHB for average lot cost of $58,000 would equal $138,200.
- There are likely to be other costs, such as sales tax, fees, closing costs, insurance, mortgage protection coverage, etc.
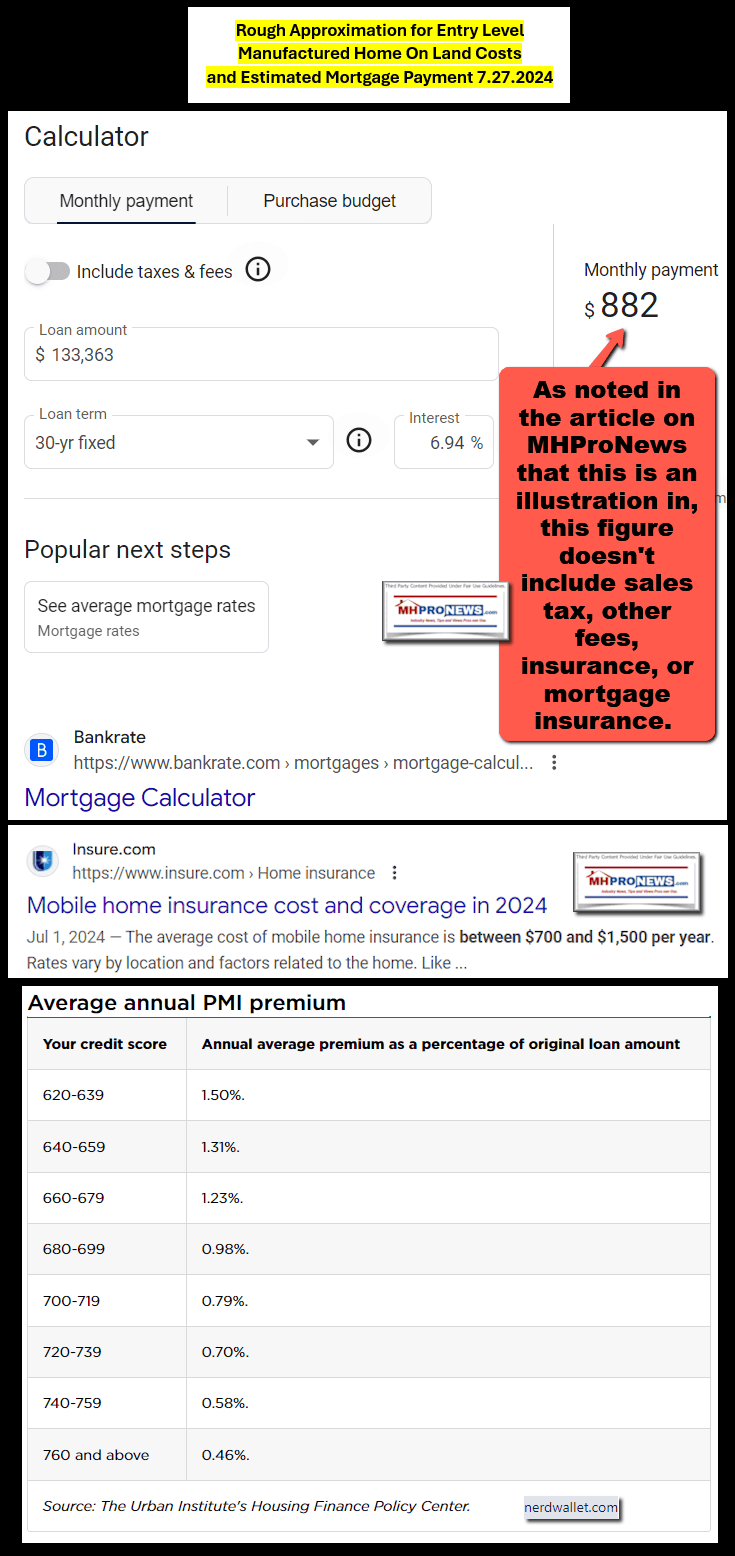
- While reportedly most FHA lenders that make manufactured home loans have an ‘overlay’ that pushes buyers into multi-sectional purchases, technically, FHA Title II loans can be used to buy a manufactured home on land. Per Bankrate on “Saturday, July 27, 2024, the national average 30-year FHA mortgage interest rate is 6.94%.” The down payment on an FHA Title II loan is 3.5% of the purchase price for borrowers with a credit score of 580 or higher (it is 10 percent down if the credit is 500-579).
- Presuming a 3.5 percent down payment on $138,200 is $4,837, per Google’s calculator.
- So, financing about $133,363 at 6.94% for 30 years yields a monthly payment of about $882.
To see this image below in a larger size, depending on your device,
click the image and follow the prompts.
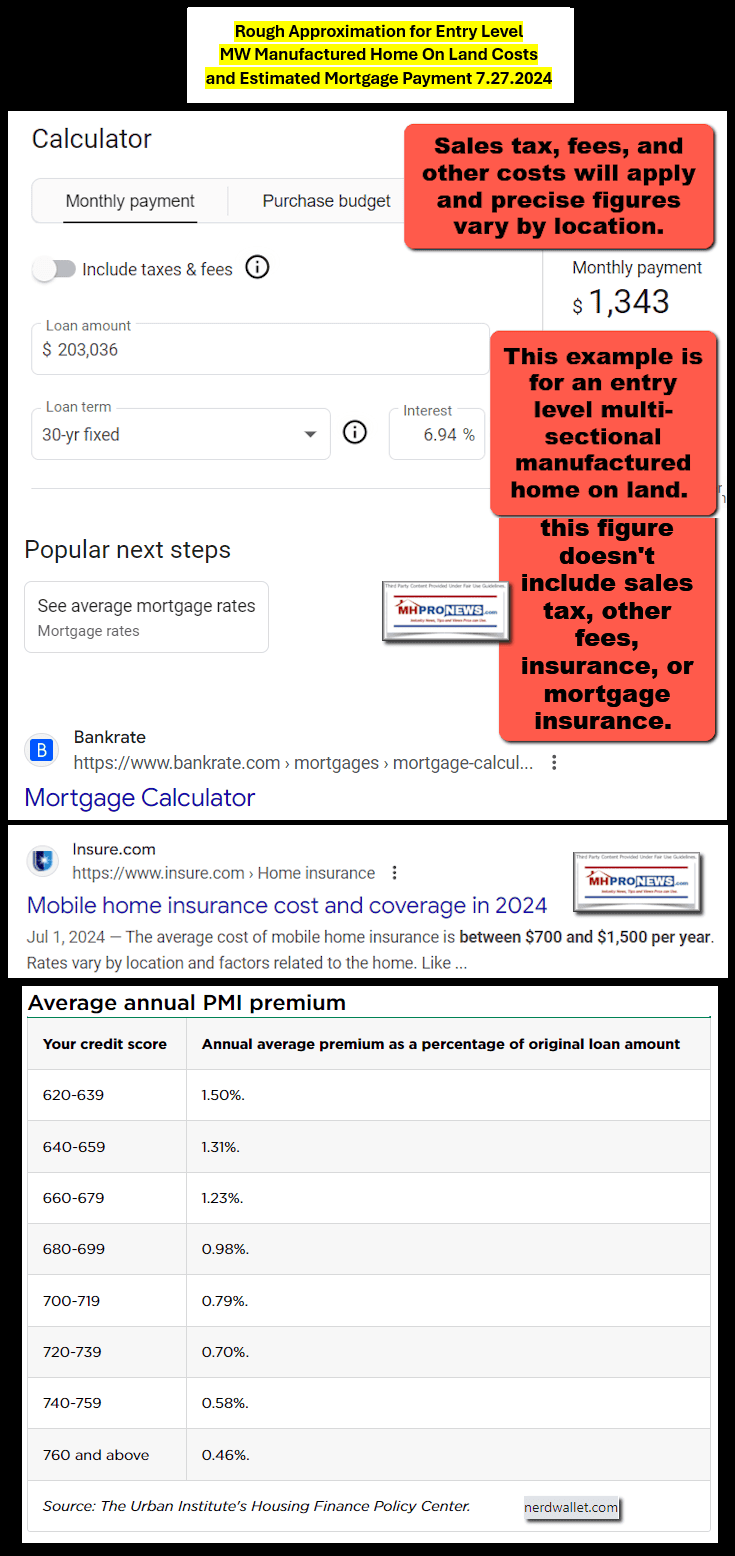
6) Applying the same notions and information in #5 above to an ‘average’ new multi-sectional (a.k.a.: ‘double wide’) manufactured home on land looks like this: $152,400 + $58,000 = $210,400.
- Presuming a credit score that justifies a 3.5 percent down on an FHA Title II loan yields about $7,364 down payment (DP) required.
- Noting the disclaimers that precise figures will vary by location, as interest rates, credit terms, sales tax, insurance and other variables that will apply, this is a rough notion of what is possible – a monthly payment of about $1343 monthly plus escrow, etc.
To see this image below in a larger size, depending on your device,
click the image and follow the prompts.
7) Let’s flip the script from the Saturday 7.27.2024 Daily Business News on MHProNews report linked further below. Imagine, for a few moments, that the Manufactured Housing Institute (MHI) is doing a terrific job, IF their goal is to throttle manufactured housing industry production so that consolidators who think that lower sales and fewer developments somehow benefits their business model.
But that would not be the common thought process for many professions.
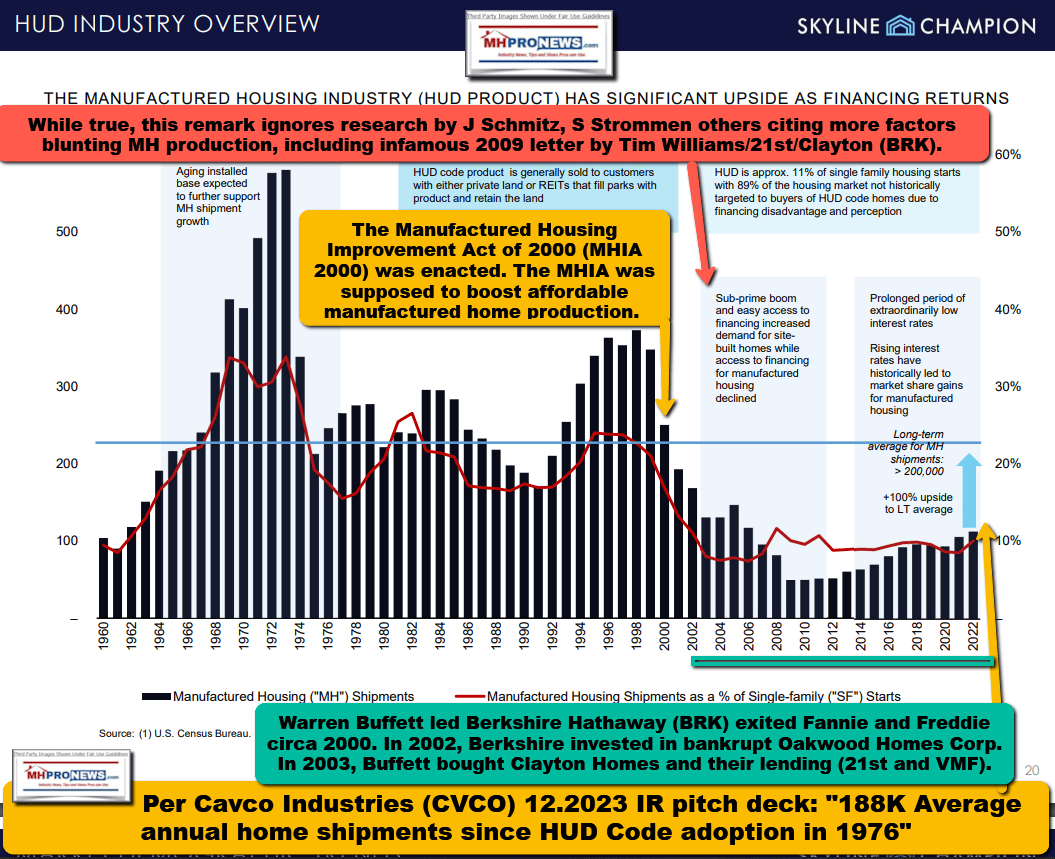
Imagine instead, for instance, if the powers that be in the automobile industry decided to throttle their production levels from the late 1990s to just 75 percent of where that as their goal for today. The hypothetical rationale might be so that used car prices would be artificially inflated as a result of high demand and insufficient new vehicle inventory. Based on the information below from the U.S. Department of Energy (DOE), there were about 14.5 million light duty vehicles produced in the U.S. in 1998. There were 16.14 million units produced in 2019. Following the declared COVID 19 pandemic, production dropped (see graphic below), and as millions know, the cost of used vehicles jumped in the Biden-Harris era. Something similar occurs as a result of the law of supply and demand in housing too, only housing often is viewed as “appreciating.” While it might be true that fewer new developments, for example, using manufactured homes could result in higher per lot values for some manufactured home communities (MHCs), what multifamily housing (i.e.: apartment) developer would say, ‘we aren’t going to build but a few new apartment complexes in 2024 or 2025 so that we can prop up occupancy and valuations in existing properties’ – see the vexing analogy? Doing so could see even higher rents for new apartments if that occurred, that’s what the law of supply and demand says, and that is what HUD researchers concluded. Too little production yields higher prices on existing properties.
8) There are political, regulatory, media, competitors, and industry insider factors that contribute to the relatively low production of new manufactured homes. But keep in mind that Freddie Mac said in research linked below that some 25 to 26 million households that currently rent could qualify for a manufactured home. Looking at the data in #5 and #6 above, it is easily understandable how Freddie Mac’s assertion could be true. What that means is that manufactured home production could soar to new records, if MHI were using their legal and advocacy muscle successfully instead of merely talking about meetings and memos.

9) Why isn’t MHI and MHI linked trade media publishing such information? Why are those in the MHI orbit so focused instead on what Copilot has called “Orwellian” communications that obscure authentic manufactured housing history, potential, and insights that reveal the troubling nature of MHI’s performance? See that in the Saturday Daily Business News on MHProNews report linked below.
What ought to be clear is this. During an affordable housing crisis, manufactured housing ought to be soaring. Instead, it is operating at a lower level than virtually all of the 2oth century, when the population was lower.
To see this image below in a larger size, depending on your device,
click the image and follow the prompts.
To learn more, see the headline reports in Part IV, check out the links to individual publicly-traded MHI member firms in any of the Daily Business News on MHProNews reports linked below for more specific insights, and don’t miss today’s postscript (Part V).
With no further adieu, here are the headlines for this Sunday’s weekly review from 7.21 to 7.28.2024.
Part IV
What’s New on MHLivingNews


To see this image below in a larger size, depending on your device,
click the image and follow the prompts.

What’s News from Washington, D.C. Based MHARR




What’s New on the Masthead



Select Items from best-selling author Tim Connors, CSP, Words of Wisdom


What’s New on the Daily Business News on MHProNews
Saturday 7.27.2024

Friday 7.26.2024

Thursday 7.25.2024

Wednesday 7.24.2024

Tuesday 7.23.2024

Monday 7.22.2024

Sunday 7.21.2024

Postscript (Part V)
1) MHProNews routinely gets timely replies to inquiries from MHARR, from public officials, various mainstream media, third-party researchers, and other trade groups. But in recent years, MHI has – for their own leadership’s motives and reasons – decided not to reply to inquiries, and that includes inquiries to MHI’s outside attorney, David Goch. This may be part of Copilot refers to as a lack of accountability and transparency on the part of MHI. That is true despite the fact that Copilot has lauded our platform’s accuracy and logic. Our trade media platforms have also been numbers of leaders in manufactured housing, including MHI leaders, including competitors.
To see this image below in a larger size, depending on your device,
click the image and follow the prompts.


2) The top two brands in manufactured housing in 1998 outproduced the entire production of HUD Code manufactured housing in 2023. That’s a fact. Such facts are ignored or obscured by others in MHVille, but not by MHProNews and MHLivingNews.

3) What is beyond doubt is that for all of MHI’s bluster, self-praise and a circle fest of accolades by industry insiders about MHI, the industry is performing at about 1/4th of the production level that as achieved in 1998. Several of MHI’s own members have said that more is doable, but they have failed to take the steps that MHI’s own leaders have said were needed. Is it any surprise that stock analyst Greg Palm questioned why the industry was performing at such a low level? The facts and evidence are available in abundance, for those willing to look beyond what MHI insiders – busy consolidating the industry, thanks in part to underperformance – have to say. But even some of them have bluntly pointed the finger at MHI.


4) This article opened with this:

MHARR has said the Congress and public officials need to investigate manufactured housing.
MHProNews similarly believes that the evidence warrants a probe by antitrust and other officials at the state and/or federal levels. Learn more via the linked reports. For the latest Trump vs. Harris polling results and more, see below.
Programming Notice: quarterly reporting season is drawing nigh. Watch for exclusive analysis and an array of facts from MHProNews.
Programming Notice 2: a firm that has attended MHI’s annual meeting is accused by residents of several possible violations of laws and regulations. MHProNews is developing a report. Watch for it. Until next time, take care. ###
To see this image below in a larger size, depending on your device,
click the image and follow the prompts.

My fellow Democrats, I have decided not to accept the nomination and to focus all my energies on my duties as President for the remainder of my term. My very first decision as the party nominee in 2020 was to pick Kamala Harris as my Vice President. And it’s been the best… pic.twitter.com/x8DnvuImJV
— Joe Biden (@JoeBiden) July 21, 2024
If Joe Biden ends his reelection campaign, how can he justify remaining President?
Not running for reelection would be a clear admission that President Trump was right all along about Biden not being mentally fit enough to serve as Commander-in-Chief.
There is no middle ground.
— JD Vance (@JDVance1) July 21, 2024
Then RESIGN your office. If you can’t run a mere political campaign, you can’t be President https://t.co/wbO9fs0TyN
— Josh Hawley (@HawleyMO) July 21, 2024
I heard last week that he would resign at this exact time and date. It was widespread knowledge in DC.
The real powers that be are discarding the old puppet in favor of one that has a better chance of fooling the public.
They fear Trump because he is not a puppet.
— Elon Musk (@elonmusk) July 21, 2024
It’s time for us all to unite around Kamala Harris and beat Donald Trump. She is the best and most qualified candidate we have. Long live the American Dream! 🇺🇸 🗽 #Harris2024 pic.twitter.com/KG09YnWHZK
— Alex Soros (@AlexanderSoros) July 21, 2024
Statement from President Clinton and Secretary Clinton pic.twitter.com/R7tYMFWbsu
— Bill Clinton (@BillClinton) July 21, 2024
Kamala Harris owns the entire leftwing policy record of Joe Biden. The only difference is that she is even more liberal and less competent than Joe, which is really saying something. She was put in charge of the border and we saw the worst invasion of illegals in our history!!!
— Donald Trump Jr. (@DonaldJTrumpJr) July 21, 2024
Kamala was in on it. She covered up Joe’s obvious mental decline. Kamala knew Joe couldn’t do the job, so she did it. Look what she got done: a border invasion, runaway inflation, the American Dream dead. pic.twitter.com/H3Oyew0ug9
— MAGA War Room (@MAGAIncWarRoom) July 21, 2024
At this unprecedented juncture in American history, we must be clear about what just happened. The Democrat Party forced the Democrat nominee off the ballot, just over 100 days before the election.
Having invalidated the votes of more than 14 million Americans who selected Joe…
— Speaker Mike Johnson (@SpeakerJohnson) July 21, 2024
Black Lives Matter Attacks Democratic Party for ‘Anointing’ Kamala Harris without Primary Votes
Not even BLM agrees with the Democrats imposing Kamala to all their registered voters
Way to go in defending Democracy! pic.twitter.com/8AdhqzZq6P
— Davy Jones (@AtDavyJones) July 25, 2024
Makes sense to me!!
Black Lives Matter understands this is a subversion of democracy. Make Kamala Harris really earn her candidacy through the will of the People! pic.twitter.com/NiMQF4NfhZ
— jaylen (@jaylen_nv) July 23, 2024
People should not underestimate Kamala Harris. Seriously. The following is per Real Clear Politics on 7.27.2024.
| Saturday, July 27 |
| Friday, July 26 |
| Race/Topic (Click to Sort) | Poll | Results | Spread |
|---|---|---|---|
| General Election: Trump vs. Harris | Forbes/HarrisX | Trump 51, Harris 49 | Trump +2 |
| General Election: Trump vs. Harris vs. Kennedy vs. Stein vs. West | Forbes/HarrisX | Trump 44, Harris 44, Kennedy 10, Stein 1, West 1 | Tie |
| Thursday, July 25 |
| Race/Topic (Click to Sort) | Poll | Results | Spread |
|---|---|---|---|
| General Election: Trump vs. Harris | NY Times/Siena | Trump 48, Harris 47 | Trump +1 |
| General Election: Trump vs. Harris vs. Kennedy vs. Stein vs. West | NY Times/Siena | Trump 43, Harris 44, Kennedy 5, Stein 1, West 0 | Harris +1 |
| Arizona: Trump vs. Harris | The Hill/Emerson | Trump 49, Harris 44 | Trump +5 |
| Georgia: Trump vs. Harris | The Hill/Emerson | Trump 48, Harris 46 | Trump +2 |
| Michigan: Trump vs. Harris | The Hill/Emerson | Trump 46, Harris 45 | Trump +1 |
| Wednesday, July 24 |
| Race/Topic (Click to Sort) | Poll | Results | Spread |
|---|---|---|---|
| General Election: Trump vs. Harris | CNN | Trump 49, Harris 46 | Trump +3 |
| Pennsylvania: Trump vs. Harris | AmGreatness/NSOR | Trump 47, Harris 45 | Trump +2 |
| Tuesday, July 23 |
| Monday, July 22 |
| Sunday, July 21 |
| Race/Topic (Click to Sort) | Poll | Results | Spread |
|---|---|---|---|
| Michigan: Trump vs. Biden | Detroit Free Press/EPIC-MRA | Trump 49, Biden 42 | Trump +7 |
| Michigan: Trump vs. Biden vs. Kennedy vs. West vs. Stein | Detroit Free Press/EPIC-MRA | Trump 43, Biden 36, Kennedy 8, West 2, Stein 2 | Trump +7 |
But if Harris wins, it will be because people are driven by faux fear, by thoughtless habits, and costly propaganda. Harris’ record should cause her to lose “biggly.” A snarky and satirical video tweet that has been viewed over 50 million times already is followed by others.
53 million views. https://t.co/e62aeKGPon
— Catturd ™ (@catturd2) July 27, 2024
Bill Maher just *NUKED* Kamala from orbit 🔥pic.twitter.com/LqCiiIcGvn
— Kyle Becker (@kylenabecker) July 27, 2024
Is this Joe Biden??? https://t.co/KQ8MRyKLla
— Juanita Broaddrick (@atensnut) July 27, 2024
Yeah, apparently he walks faster than his son and a better gait than before.
— Barb🇺🇸🇺🇸🇺🇸 (@BarbGEO47) July 27, 2024
REPORT: The media is currently rewriting history in an effort to help the Harris campaign.
Here are 5 hoaxes the media has launched in the past week.
5. CBS claims Trump is lying by saying Harris donated to Minnesota Freedom Fund, bailing out “dangerous criminals” during the… pic.twitter.com/HEjlJnE8Kx
— Collin Rugg (@CollinRugg) July 26, 2024
HOLY COW!
Does anyone see what’s happening in New York?
HUNDREDS of New York citizens are protesting against an illegal alien shelter in Brooklyn, NY.
I have never seen anything like this.
Why is no one reporting?
This is from TODAY!
h/t @letsgobrandon75 pic.twitter.com/9KxvYHvu4u
— ThePersistence (@ScottPresler) July 27, 2024
This clip cannot be watched enough. Keep reposting it.
Kamala walked off the stage in flames😆😂 pic.twitter.com/bF52yuDKou
— Spitfire (@DogRightGirl) July 26, 2024
CBS lies about Trump lying pic.twitter.com/GLmm8u6Mqr
— Elon Musk (@elonmusk) July 26, 2024
Save our kids!
pic.twitter.com/1obaIHBv0A— Elon Musk (@elonmusk) July 27, 2024
Here it is: Kamala Harris all but announces she is a communist.
“Everyone ends up in the same place. And since we didn’t start in the same place, some folks might need more. EQUITABLE distribution.”
Harris paraphrases Marx: “From each according to his ability to each according… pic.twitter.com/lV5tkFs9x6
— Kyle Becker (@kylenabecker) July 26, 2024
🚨 MASSIVE crowds are gathered in Downtown Nashville to greet President Trump
I love to see this! 🇺🇸 pic.twitter.com/xMzRSKKPCo
— Nick Sortor (@nicksortor) July 27, 2024
New Trump Ad 🔥
— Benny Johnson (@bennyjohnson) July 27, 2024
;
This is the chart #KamalaHarris doesn’t want you to read, let alone analyze. This also is the chart that saved his life, he glanced back to see it and the bullets missed him. Take a glance, it must be important. https://t.co/GYc7Js4m28
— Cowboy Patriot (@CowboyPatriot88) July 24, 2024


