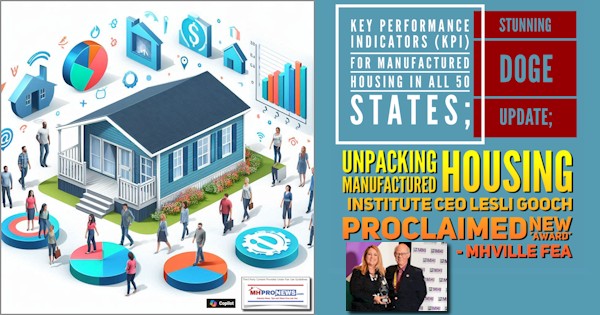
“In order for a first-time homebuyer to afford a typical starter home in the U.S., they must earn about $64,500—an increase of 13% from a year ago, in large part because of higher mortgage rates, fewer listings and higher home prices, according to a new study from Redfin.” So wrote Molly Bohannon for Forbes on 7.29.2023. Fewer listings, higher home prices and higher mortgage rates are obviously irksome to buyers. Nevertheless, the information from Redfin could be used by a national post-production trade group to attract affordable housing seekers to check out all that contemporary manufactured homes has to offer. But approaching a dozen years since Kevin Clayton with Berkshire Hathaway owned Clayton Homes said back then that the manufactured home industry was ‘ready’ with a Recreational Vehicle Industry Assocation (RVIA) style GoRVing campaign, there is still no such educational/marketing national manufactured housing campaign visible in the U.S.A. Supposedly related on the state level are efforts to promote manufactured housing sales. Despite the de facto ‘endorsement’ by Manufactured Housing Institute (MHI) member emeritus George F. Allen, who on his blog pitched this notion. “And manufacturedhomes.com is working with 15 state associations to enhance their online presence. The unasked question, in my mind, was “Why aren’t all state MH associations on board to improve their representation of manufactured housing and land lease communities nationwide?” What Allen’s remarks failed to recognize is that manufactured housing is in a downturn in 2023. That downturn is occurring despite those state efforts by ManufacturedHomes.com, which begs the question, what is manufacturedhomes.com not doing properly? That question is answered in part by a new article by Mark Weiss, J.D., President and CEO of the Manufactured Housing Association for Regulatory Reform (MHARR), explored below. To the point of the industry’s now 8 months of sequential downturn, even MHI vice-chairman William “Bill” Boor – who is also president and CEO of Cavco Industries (CVCO) – publicly acknowledged that in his remarks to Congress. Per Boor on behalf of MHI: “The manufactured housing industry is at a critical crossroads due to regulatory barriers and market forces. Cumulative shipments from January 1 through April 30, 2023, decreased by 30 percent compared to the same time period of 2022. April 2023 shipments were down 34 percent compared to April 2022 shipments.”
Put differently, the data Boor cited reveals that neither MHI nor ManufacturedHomes.com are effectively advancing the interests of HUD Code manufactured housing growth. If either of those two organizations – or others named by Weiss – were doing their claimed jobs properly, those stark numbers from Boor would be rising sharply, not falling sharply. That’s just common sense.
More on that and more from MHARR this week in their latest Issues and Perspectives report and analysis featured among our headlines for the week that was 7.30.2023. Hold those thoughts in mind while considering the following facts and revelations per national real estate platform Redfin.
Shifting back to Redfin’s research, which could be useful to affordable manufactured housing professionals. Per Dana Anderson for Redfin on 7.28.2023 is the following under their headline as shown below.

- Rising home prices and elevated mortgage rates have pushed the income necessary to buy the typical U.S. starter home up 13% over the last year.
- New listings of starter homes are down 23%, the biggest decline since the start of the pandemic.
- San Francisco, Austin and Phoenix are the only major U.S. metros where the income needed to buy a starter home has dropped over the last year. It has risen over 20% in Fort Lauderdale, FL and Miami, more than anywhere else in the country.
- The share of starter homes going to all-cash buyers is near a decade high.
A first-time homebuyer must earn roughly $64,500 per year to afford the typical U.S. “starter” home, up 13% ($7,200) from a year ago. That’s due to the one-two punch of higher mortgage rates and higher home prices.
The typical starter home sold for a record $243,000 in June, up 2.1% from a year earlier and up more than 45% from before the pandemic. Average mortgage rates hit 6.7% in June, up from 5.5% the year before and just under 4% before the pandemic.

This is according to an analysis that divides all U.S. residential properties into five buckets based on Redfin Estimates of the homes’ market values as of June 2023. The data is analyzed using three-month moving periods; when we say “June,” we’re referring to April-June. There are three equal-sized tiers, as well as tiers for the bottom 5% and top 5% of the market.
This report is focused on the “affordable” tier, also referred to as “starter” homes in this report, which is made up of homes estimated to be in the 5th-35th percentile by sale price. We calculated how much annual income is needed to afford a starter home by using the rule of thumb that a home is considered “affordable” if a buyer taking out a mortgage spends no more than 30% of their income on their housing payment.
Prices for starter homes continue to tick up because there are so few homes for sale, often prompting competition and pushing up prices for the ones that do hit the market. New listings of starter homes for sale dropped 23% from a year earlier in June, the biggest drop since the start of the pandemic. The total number of starter homes on the market is down 15%, also the biggest drop since the start of the pandemic. Limited listings and still-rising prices, exacerbated by high mortgage rates, have stifled sales activity. Sales of starter homes dropped 17% year over year in June.
“Buyers searching for starter homes in today’s market are on a wild goose chase because in many parts of the country, there’s no such thing as a starter home anymore,” said Redfin Senior Economist Sheharyar Bokhari. “The most affordable homes for sale are no longer affordable to people with lower budgets due to the combination of rising prices and rising rates. That’s locking many Americans out of the housing market altogether, preventing them from building equity and ultimately building lasting wealth. People who are already homeowners are sitting pretty, comparatively, because most of them have benefited from home values soaring over the last few years. That could lead to the wealth gap in this country becoming even more drastic.”
Home prices shot up during the pandemic due to record-low mortgage rates and remote work, and now rising mortgage rates are exacerbating the affordability crisis, especially for first-time buyers. A person looking to buy today’s typical starter home would have a monthly mortgage payment of $1,610, up 13% from a year ago and nearly double the typical payment just before the pandemic. Average U.S. wages have risen 4.4% from a year ago and roughly 20% from before the pandemic, not nearly enough to make up for the jump in monthly mortgage payments.
Many prospective first-time homebuyers are between a rock and a hard place because rents remain elevated, too. The typical U.S. asking rent is just $24 shy of the $2,053 peak hit in 2022.
Buyers with higher budgets have seen their monthly payments increase quite a bit, too. People buying today’s typical home in the “middle” and “expensive” tiers would have a monthly housing payment 13% higher than they would have a year ago. Sale prices are up 1.5% year over year for the “middle” tier, and 2.2% for the “high” tier–comparable to the increase for starter homes.
But the impact of rapidly rising monthly housing payments is more drastic for buyers searching for an affordable starter home. Many of those people–often first-time homebuyers–are priced out of the housing market entirely because there’s no room to lower their budget. Buyers searching for higher-priced homes can lower their price range and perhaps search for smaller homes in less expensive neighborhoods.
San Francisco, Austin and Phoenix are the only U.S. metros where starter-home buyers need less income than they did a year ago
First-timers and other lower-budget buyers in a few metros are getting some relief: San Francisco, Austin and Phoenix buyers don’t need to earn quite as much as they did a year ago to afford a starter home, as those are the only three major U.S. metros where prices have declined.
A homebuyer in San Francisco must earn $241,200 to afford the typical “starter” home, down 4.5% ($11,300) from a year earlier. Austin buyers must earn $92,000, down 3.3% year over year, and Phoenix buyers must earn $86,100, down about 1%. Those are also the metros where prices of starter homes have declined most, with median sale prices down 13.3% to $910,000 in San Francisco, down 12.2% to $347,300 in Austin, and down 9.7% to $325,000 in Phoenix.
Starter-home prices are falling in those three metros after skyrocketing in 2020 and 2021. Bay Area prices soared because buyers used record-low mortgage rates as an opportunity to jump into the expensive market, and Austin and Phoenix prices went wild because of the influx of remote workers moving into those places.
Now that mortgage rates have more than doubled, the initial surge of remote-work relocations has passed, and new listings are scarce due to homeowners locked in by low rates, the housing markets in Austin and Phoenix have fallen back down to earth. Demand in San Francisco dropped because rising rates made ultra-expensive homes even more expensive, and many tech workers aren’t as incentivized to live near city centers as they once were.
Starter-home prices are down year over year in 13 other metros, mostly expensive West Coast markets, with the next-biggest declines in San Jose, CA (-8.7% to $925,000), Sacramento, CA (-7.3% to $417,000) and Oakland, CA (-7.3% to $630,000). Starter-home prices also dropped in Las Vegas, Seattle, Denver, Los Angeles, Portland, OR, Anaheim, CA, San Diego, Riverside, CA, Pittsburgh and Minneapolis. But the income necessary to buy a starter home has still risen, because in those places lower prices don’t make up for higher mortgage rates.
Miami first-time homebuyers need 25% more income
The income necessary to buy a starter home has risen most in Florida. Fort Lauderdale buyers need to earn $58,300 per year to purchase a $220,000 home, the typical price for a starter home in that area, up 28% from a year earlier. That’s the biggest uptick of the 50 most populous U.S. metros.
Next comes Miami, where buyers need to earn $79,500 (up 24.8%) to afford the typical $300,000 starter home. Rounding out the top three is Newark, NJ, where buyers need $88,800 (up 21.1%) to afford a $335,000 home. Fort Lauderdale, Miami and Newark also had the biggest starter-home price increases, with prices up 15.8% year over year, 13.2% and 9.8%, respectively.
Even though starter-home prices have risen most in Florida, they’re still less expensive than a place like Austin or Phoenix, where home prices skyrocketed during the pandemic and have since come down some.
Prices are rising in Florida because despite increasing climate risks, out-of-town remote workers and retirees are flocking in. That’s largely due to warm weather and relative affordability; even though prices there soared during the pandemic, homes are still typically less expensive than a place like New York, Boston or Los Angeles. Five of the 10 most popular metros for relocating homebuyers are in Florida.
All-cash buyers purchase nearly 40% of starter homes in the U.S.
More than one-third (36.6%) of the country’s starter homes were purchased in cash in May, down just slightly from the previous month’s decade-high and up from 35.2% a year earlier.

Note that this all-cash data is from May, the most recent month for which data is available, while the other data in this report is from June.
Real estate investors are buying up a sizable chunk of today’s affordable homes. A record 41% of investor purchases were small homes–those with 1,400 or fewer square feet–in the first quarter. That’s up from 37% a year earlier.
“Many house hunters searching for an affordable place to call home for themselves and/or their family are out of options, especially in more expensive parts of the country,” Bokhari said. “As prices for the most affordable homes continue to climb and rates remain elevated, it’s becoming more true that you have to be wealthy to buy a home–especially if it’s your first one. That’s why we’ve seen the share of affordable homes going to cash buyers, either individuals or investors, tick up: Because they’re the only ones who can afford them.”
Cash buyers also have another advantage. They don’t have to pay high mortgage rates, meaning it’s ultimately less expensive for them to buy homes, deepening the wealth gap in the country.
But even though monthly payments on starter homes are becoming more expensive and an increasing share are going to cash buyers, in some ways the market is easier to break into than it was during the pandemic buying boom. Some first-time homebuyers are able to buy a home without a bidding war, and in some metros prices have come down, as noted above.
Other metro-level highlights for starter homes, June 2023
The biggest price declines and increases are noted in the text above
Prices are highest in California. Starter homes have the highest median sale price in San Jose ($925,000), San Francisco ($910,000) and Anaheim ($680,000).
Prices are lowest in the Rust Belt. The typical starter home sells for $60,000 in Detroit, the lowest of the 50 most populous U.S. metros. It’s followed by Pittsburgh ($100,000) and Cleveland ($115,000).
New listings declined most in pandemic migration hotspots. New listings of starter homes dropped from a year earlier in all but one of the 50 most populous U.S metros, with the biggest declines in migration magnets. New listings fell most in Sacramento, CA (-44.8%), Phoenix (-44.3%) and Las Vegas (-43.2%). They increased 7% in Detroit.
Sales fell most on the West Coast. Sales of starter homes dropped in 45 of the 50 most populous metros. They declined most year over year in Seattle (-36.5%), Sacramento (-35.9%), San Francisco (-35.4%), San Jose, CA (-34.5%) and Portland, OR (-33.9%).
Sales rose in Texas. Sales increased from a year earlier in San Antonio, TX (11.6%), Detroit (10.1%), Philadelphia (3.4%), Dallas (2.5%), and Fort Worth, TX (0.6%).
| Metro-level summary: Income need to afford a starter home, June 2023
50 most populous U.S. metros Ranked by change in income needed to afford a starter home, YoY, with biggest decline at the top Income needed = income necessary to afford the typical monthly mortgage payment on the median-priced starter home. Starter home = 5th-35th percentile of homes sold, by sale price |
||||
| U.S. metro area | Income needed | Median sale price | Median mortgage payment | Change in income needed, YoY |
| San Francisco, CA | $241,181 | $910,000 | $6,030 | -4.5% |
| Austin, TX | $92,057 | $347,340 | $2,301 | -3.3% |
| Phoenix, AZ | $86,136 | $325,000 | $2,153 | -0.5% |
| San Jose, CA | $245,157 | $925,000 | $6,129 | 0.6% |
| Sacramento, CA | $110,519 | $417,000 | $2,763 | 2.2% |
| Oakland, CA | $166,972 | $630,000 | $4,174 | 2.2% |
| Las Vegas, NV | $76,860 | $290,000 | $1,922 | 3.1% |
| Seattle, WA | $141,794 | $535,000 | $3,545 | 4.4% |
| Denver, CO | $109,989 | $415,000 | $2,750 | 4.7% |
| Los Angeles, CA | $151,070 | $570,000 | $3,777 | 4.7% |
| Portland, OR | $109,327 | $412,500 | $2,733 | 5.8% |
| Anaheim, CA | $180,224 | $680,000 | $4,506 | 6.3% |
| San Diego, CA | $161,671 | $610,000 | $4,042 | 6.7% |
| Riverside, CA | $104,689 | $395,000 | $2,617 | 7.5% |
| Pittsburgh, PA | $26,424 | $99,700 | $661 | 8.8% |
| Minneapolis, MN | $68,909 | $260,000 | $1,723 | 9.8% |
| Detroit, MI | $15,902 | $60,000 | $398 | 10.2% |
| Dallas, TX | $72,885 | $275,000 | $1,822 | 10.6% |
| Washington, DC | $90,894 | $342,950 | $2,272 | 11.5% |
| Philadelphia, PA | $34,985 | $132,000 | $875 | 11.9% |
| Nashville, TN | $82,161 | $310,000 | $2,054 | 12.0% |
| Atlanta, GA | $68,909 | $260,000 | $1,723 | 12.4% |
| Nassau County, NY | $124,566 | $470,000 | $3,114 | 12.6% |
| Baltimore, MD | $54,332 | $205,000 | $1,358 | 12.7% |
| Boston, MA | $121,916 | $460,000 | $3,048 | 12.7% |
| Tampa, FL | $66,259 | $250,000 | $1,656 | 12.9% |
| Chicago, IL | $48,987 | $184,833 | $1,225 | 13.2% |
| Orlando, FL | $67,584 | $255,000 | $1,690 | 13.3% |
| Warren, MI | $46,381 | $175,000 | $1,160 | 13.5% |
| Kansas City, MO | $43,731 | $165,000 | $1,093 | 13.7% |
| Houston, TX | $57,513 | $217,000 | $1,438 | 13.9% |
| New York, NY | $116,615 | $440,000 | $2,915 | 14.1% |
| St. Louis, MO | $31,804 | $120,000 | $795 | 14.1% |
| Cleveland, OH | $30,479 | $115,000 | $762 | 14.2% |
| Fort Worth, TX | $64,933 | $245,000 | $1,623 | 14.4% |
| Virginia Beach, VA | $59,633 | $225,000 | $1,491 | 15.4% |
| Charlotte, NC | $62,283 | $235,000 | $1,557 | 15.4% |
| New Brunswick, NJ | $87,461 | $330,000 | $2,187 | 16.2% |
| Providence, RI | $86,666 | $327,000 | $2,167 | 17.4% |
| Cincinnati, OH | $42,406 | $160,000 | $1,060 | 17.6% |
| Indianapolis, IN | $42,406 | $160,000 | $1,060 | 17.6% |
| Columbus, OH | $48,501 | $183,000 | $1,213 | 18.7% |
| San Antonio, TX | $55,657 | $210,000 | $1,391 | 18.7% |
| West Palm Beach, FL | $64,933 | $245,000 | $1,623 | 19.0% |
| Jacksonville, FL | $63,608 | $240,000 | $1,590 | 19.2% |
| Montgomery County, PA | $82,161 | $310,000 | $2,054 | 19.9% |
| Milwaukee, WI | $46,381 | $175,000 | $1,160 | 20.6% |
| Newark, NJ | $88,787 | $335,000 | $2,220 | 21.1% |
| Miami, FL | $79,510 | $300,000 | $1,988 | 24.8% |
| Fort Lauderdale, FL | $58,308 | $220,000 | $1,458 | 27.6% |
| National – U.S.A. | $64,403 | $243,000 | $1,610 | 12.6% |
| Monthly median mortgage payments are calculated assuming the buyer made a 20% down payment, and they take that month’s median sale price and average mortgage-interest rate into account. They include principal, interest, taxes and insurance. | ||||
##
Note that Redfin said: “Real estate investors are buying up a sizable chunk of today’s affordable homes. A record 41% of investor purchases were small homes–those with 1,400 or fewer square feet–in the first quarter. That’s up from 37% a year earlier.”
If MHI were doing their job properly and successfully, what’s problematic for conventional real estate buyers could be turned into a magnet for sellers of new HUD Code manufactured homes.
Cavco CEO Boor, in remarks to Congress cited in its full context at this link here, said the following on behalf of MHI.
- “Rather than artificially making it more difficult for us to produce quality, affordable housing we believe there are things that Congress and federal agencies can do to facilitate the availability of manufactured housing.”
- “Manufactured housing offers affordability and quality to consumers because of technological advancements, cost savings, and efficiencies associated with the factory-built process.”
In essence, a fair takeaway from Boor’s quoted remarks represents an essentially vexing confirmation of what Daniel R. Mandelker, J.D., previously said in his research into manufactured housing. An organization is needed for manufactured housing, said Mandelker, for litigation and legislative support. Ouch! Aren’t those among the items Mandelker says are missing in MHVille that MHI claims they are doing?

Making Sense of What’s Occurred and Trending in Manufactured Housing
There are plenty of places online someone can go to read all sorts of things about modern manufactured homes. Among them are places that have ‘historic’ insights into manufactured housing. They may include accurate, inaccurate, agenda-driven claims and assertions.
What is unlikely to be found in a trade publication is anywhere nearly as complete a picture of why modern manufactured homes are operating at about an annualized rate of some 85,725 new HUD Code manufactured homes. Here is the math on that figure. MHARR said regarding May 2023 data that: “Cumulative production for 2023 is now 35,719 homes, a 33.8% decrease from the 50,286 homes produced over the same period during 2022.” 35,719/5 = 7,143.8 units monthly average year to date in 2023. Take that 7143.8 x 12 = 85,725.6.
An attorney who owns multiple conventional houses recently told MHProNews of his surprise when he learned that the manufactured home industry produced only 112,882 nationally in all of 2022. Imagine how surprised he might be if he had been advised that the 2023 production level, unless dramatically corrected, will bring the industry in at potentially 2016 to 2017 manufactured home shipment levels?
Why is the industry underperforming during an affordable housing crisis?
Don’t miss today’s postscript following these headlines in review.
That topic of why the industry is underperforming and more are explored in several of the fact- and evidence-packed research found in the headlines for the week that was which follows for 7.23 to 7.30.2023. With no further adieu, here are those reports, tips, analysis and commentaries.
What’s New in July 2023 from Washington, D.C. from MHARR
MHARR Highlights Key Industry Issues in MEETING with HUD Assistant Secretary
Alarming Year-Over-Year Manufactured Home Production Declines Continue
What’s New on MHLivingNews


What’s New in July 2023 on the Masthead
What’s New on the Daily Business News on MHProNews for the Weekly Recap of MHVille (a.k.a. what Boor aptly said was the “artificially” smaller manufactured housing industry) Headlines
Saturday 7.29.2023
Friday 7.28.2023
Thursday 7.27.2023
Wednesday 7.26.2023
Tuesday 7.25.2023
Monday 7.24.2023
Sunday 7.23.2023
Postscript
Recapping from the top, Bohannon for Forbes said: “In order for a first-time homebuyer to afford a typical starter home in the U.S., they must earn about $64,500—an increase of 13% from a year ago, in large part because of higher mortgage rates, fewer listings and higher home prices, according to a new study from Redfin.”
Liars lie. Deceivers deceive. When someone into paltering palters, those behaviors should come as no surprise.
The question should be, what do those sick and tired of the status quo do to change things for the better?
One possible answer is that the tens of thousands of employees and workers in manufactured housing working for firms that are MHI members with a problematic reputation ought to explore their options. That was unpacked in the report linked above and here. With those problematic firms in mind, consider the following.
From Dave Hause’s song Saboteurs are these lyrics.
Once Upon a Time…
- 1) Millions were outraged at Bud Light or Target ‘going woke.’ Using the simple economic clout of not buying their products, both brands have been hit hard by billions of dollars in lost revenue and a sharp decline in their respective stock’s value.
- 2) Just the credible threat of a strike by manufactured housing employees and workers against some of the major brands in MHVille could lead to positive changes. Look at the strike threat by workers at UPS as an example for MHVille.
- 3) Similarly, organizing to get anti-monopoly laws enforced could be a deft and profitable solution to those who make it happen.
- 4) Insiders who are, or who sincerely want to become, white hat leaders and who have capital access can simply compete against the ‘predatory’ brands operated by the ‘big boys.’
- 5) Outsiders looking into MHVille who have the capital and chutzpah could enter the industry with the mindset that they will do what MHI and their insiders won’t or don’t.
- 6) To the point in bullet #5 above, ironically a key and valid takeaway from Cavco’s investor pitch reveals how potentially profitable and good for America such a plan could be.
It should be self-evident that in order to effect positive changes, it should be obvious that certain positive change must be embraced. Do what Warren Buffett does in this specific sense. Carefully read the reports linked herein. Get out your iPad, iPhone, Android, or other smart device to take notes. Or get out a good-old fashion pen and notepad and make notes while you are reading.
Make notes on the ideas that come to mind that can help you breach the moat of those who have rigged the system in manufactured housing.
Readers who learn the ropes can become doers and leaders.
It can all be done legally, morally, and ethically.
Millions can benefit.
Millions more could get their piece of the American Dream.
Invest the time, necessary efforts and energy and supplant the morally bankrupt in MHVille with a new breed of white hat leaders that can help manufactured housing become all that it was meant to be. The potential is enormous. ##
Notice: the graphic below can be expanded to a larger size.
See the instructions below the graphic below or click the image and follow the prompts.

Notice: the graphic below can be expanded to a larger size.
See the instructions below the graphic below or click the image and follow the prompts.


MHProNews will continue to unpack the various remarks and reports that emerge in manufactured housing. No one else digs deeper on each of these topics and other vexing issues that emerge. To learn more read the linked and related reports. Note that the typical MHProNews reader in 2022 visited some 10+ pages per visit. So, every time you click another link and read on, you are in the company of well over a million visitors annually who are doing the same. ###




Again, our thanks to free email subscribers and all readers like you, as well as our tipsters/sources, sponsors and God for making and keeping us the runaway number one source for authentic “News through the lens of manufactured homes and factory-built housing” © where “We Provide, You Decide.” © ## (Affordable housing, manufactured homes, reports, fact-checks, analysis, and commentary. Third-party images or content are provided under fair use guidelines for media.) See Related Reports, further below. Text/image boxes often are hot-linked to other reports that can be access by clicking on them.)

By L.A. “Tony” Kovach – for MHProNews.com.
Tony earned a journalism scholarship and earned numerous awards in history and in manufactured housing.
For example, he earned the prestigious Lottinville Award in history from the University of Oklahoma, where he studied history and business management. He’s a managing member and co-founder of LifeStyle Factory Homes, LLC, the parent company to MHProNews, and MHLivingNews.com.
This article reflects the LLC’s and/or the writer’s position and may or may not reflect the views of sponsors or supporters.
Connect on LinkedIn: http://www.linkedin.com/in/latonykovach
Related References:
The text/image boxes below are linked to other reports, which can be accessed by clicking on them.’
