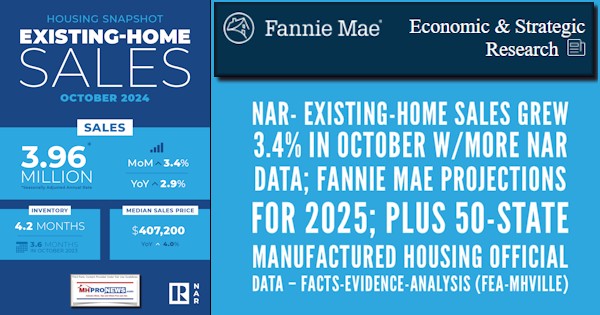
The National Association of Realtor (NAR) is what might be considered a “normal” trade group that seems to more authentically care about accurate data that is distributed to the public on a monthly basis. Like the Manufactured Housing Association for Regulatory Reform (MHARR), which also reports accurate and monthly data to all, NAR wants to keep their profession in the public eye on a routine basis. Fannie Mae isn’t a trade group, but they want to keep their business name and mortgage mission in the public’s, housing professionals, politicos, medias, and other mind via the release of information they want to be deemed as reliable. Earlier this month, MHProNews featured a report with analysis from the National Association of Home Builders (NAHB) (see Part IV). The NAHB certainly want the public to keep them and their builder-members in mind and apparently do not mind doing so in a fashion that may embarrasses their “coalition partner” MHI. With that quick overview of some U.S. housing focused trade groups and business interests, what explains the strange absence of the Manufactured Housing Institute (MHI) from the public eye by failing to similarly release accurate data to the nation at least once a month? Hold that last thought for Part IV of today’s report with analysis.
Part I of this article is the recent NAR news release provided directly to MHProNews.
Part II of this report with analysis will be information provided by Fannie Mae to MHProNews. Certainly, several high-ranking officials at Fannie are well aware of MHProNews periodic critique of that organization from this publication’s co-founder making annual remarks to FHFA listening sessions going back to 2019 and others since slamming them for failure to perform their duty on the curiously named Duty to Serve (DTS) Manufactured Housing provision of the Housing and Economic Recovery Act (HERA) of 2008. Those critiques of Fannie, to that organization’s credit, doesn’t keep them from providing their news releases directly to MHProNews. Put a check mark next to their name for that point.
Part III of this column will include the latest official data collected by the Institute for Building Technology and Safety (IBTS) on behalf of the U.S. Department of Housing and Urban Development (HUD). Production and shipment facts for the 50 states, Washington, D.C. and Puerto Rico are included.
Part IV, as noted, will be additional information with a focused MHProNews Analysis and Commentary.
Part I
News Release
|
MEDIA COMMUNICATIONS
For further information contact: Troy Green, 202/383-1042
|
Existing-Home Sales Grew 3.4% in October; First Year-Over-Year Gain Since July 2021
Key Highlights
- Existing-home sales climbed 3.4% in October to a seasonally adjusted annual rate of 3.96 million. Sales advanced 2.9% from one year ago, the first year-over-year increase in more than three years (July 2021; +1.8%).
- The median existing-home sales price ascended 4.0% from October 2023 to $407,200, the 16th consecutive month of year-over-year price gains.
- The inventory of unsold existing homes edged higher by 0.7% from the prior month to 1.37 million at the end of October, or the equivalent of 4.2 months’ supply at the current monthly sales pace.
WASHINGTON (November 21, 2024) – Existing-home sales rose in October, according to the National Association of Realtors®. Sales improved in all four major U.S. regions. Year-over-year, sales elevated in three regions but were unchanged in the Northeast.
Total existing-home sales[1] – completed transactions that include single-family homes, townhomes, condominiums and co-ops – expanded 3.4% from September to a seasonally adjusted annual rate of 3.96 million in October. Year-over-year, sales progressed 2.9% (up from 3.85 million in October 2023).
“The worst of the downturn in home sales could be over, with increasing inventory leading to more transactions,” said NAR Chief Economist Lawrence Yun. “Additional job gains and continued economic growth appear assured, resulting in growing housing demand. However, for most first-time homebuyers, mortgage financing is critically important. While mortgage rates remain elevated, they are expected to stabilize.”
Total housing inventory[2] registered at the end of October was 1.37 million units, up 0.7% from September and 19.1% from one year ago (1.15 million). Unsold inventory sits at a 4.2-month supply at the current sales pace, down from 4.3 months in September but up from 3.6 months in October 2023.
The median existing-home price[3] for all housing types in October was $407,200, up 4.0% from one year ago ($391,600). All four U.S. regions registered price increases.
“The ongoing price gains mean increasing wealth for homeowners nationwide,” Yun added. “Additional inventory and more home building activity will help price increases moderate next year.”
REALTORS® Confidence Index
According to the monthly REALTORS® Confidence Index, properties typically remained on the market for 29 days in October, up from 28 days in September and 23 days in October 2023.
First-time buyers were responsible for 27% of sales in October, up from 26% in September but down from 28% in October 2023. NAR’s 2024 Profile of Home Buyers and Sellers – released earlier this month[4] – found that the annual share of first-time buyers was 24%, the lowest ever recorded.
Cash sales accounted for 27% of transactions in October, down from 30% in September and 29% in October 2023.
Individual investors or second-home buyers, who make up many cash sales, purchased 17% of homes in October, up from 16% in September and 15% in October 2023.
Distressed sales[5] – foreclosures and short sales – represented 2% of sales in October, unchanged from last month and the previous year.
Mortgage Rates
According to Freddie Mac, the 30-year fixed-rate mortgage averaged 6.78% as of November 14. That’s down from 6.79% one week ago and 7.44% one year ago.
Single-family and Condo/Co-op Sales
Single-family home sales accelerated 3.5% to a seasonally adjusted annual rate of 3.58 million in October, up 4.1% from the prior year. The median existing single-family home price was $412,200 in October, up 4.1% from October 2023.
Existing condominium and co-op sales extended 2.7% in October to a seasonally adjusted annual rate of 380,000 units, down 7.3% from one year ago (410,000). The median existing condo price was $360,300 in October, up 1.6% from the previous year ($354,800).
Regional Breakdown
Existing-home sales in the Northeast in October grew 2.2% from September to an annual rate of 470,000, identical to October 2023. The median price in the Northeast was $472,900, up 7.6% from last year.
In the Midwest, existing-home sales bounced 6.7% in October to an annual rate of 950,000, up 1.1% from the prior year. The median price in the Midwest was $305,300, up 7.2% from October 2023.
Existing-home sales in the South climbed 2.9% from September to an annual rate of 1.77 million in October, up 2.3% from one year before. The median price in the South was $361,200, up 0.9% from one year earlier.
In the West, existing-home sales increased 1.3% in October to an annual rate of 770,000, up 8.5% from a year ago. The median price in the West was $627,700, up 4.4% from October 2023.
About the National Association of Realtors®
The National Association of Realtors® is America’s largest trade association, representing 1.5 million members involved in all aspects of the residential and commercial real estate industries. The term Realtor® is a registered collective membership mark that identifies a real estate professional who is a member of the National Association of Realtors® and subscribes to its strict Code of Ethics. For free consumer guides about navigating the homebuying and selling transaction processes – from written buyer agreements to negotiating compensation – visit facts.realtor.
# # #
For local information, please contact the local association of Realtors® for data from local multiple listing services (MLS). Local MLS data is the most accurate source of sales and price information in specific areas, although there may be differences in reporting methodology.
NOTE: NAR’s Pending Home Sales Index for October will be released November 27, and Existing-Home Sales for November will be released December 19. Release times are 10 a.m. Eastern. See NAR’s statistical news release schedule.
Information about NAR is available at nar.realtor. This and other news releases are posted in the newsroom at nar.realtor/newsroom. Statistical data in this release, as well as other tables and surveys, are posted in the “Research and Statistics” tab.
[1] Existing-home sales, which include single-family, townhomes, condominiums and co-ops, are based on transaction closings from Multiple Listing Services. Changes in sales trends outside of MLSs are not captured in the monthly series. NAR benchmarks home sales periodically using other sources to assess overall home sales trends, including sales not reported by MLSs.
Existing-home sales, based on closings, differ from the U.S. Census Bureau’s series on new single-family home sales, which are based on contracts or the acceptance of a deposit. Because of these differences, it is not uncommon for each series to move in different directions in the same month. In addition, existing-home sales, which account for more than 90% of total home sales, are based on a much larger data sample – about 40% of multiple listing service data each month – and typically are not subject to large prior-month revisions.
The annual rate for a particular month represents what the total number of actual sales for a year would be if the relative pace for that month were maintained for 12 consecutive months. Seasonally adjusted annual rates are used in reporting monthly data to factor out seasonal variations in resale activity. For example, home sales volume is normally higher in the summer than in the winter, primarily because of differences in the weather and family buying patterns. However, seasonal factors cannot compensate for abnormal weather patterns.
Single-family data collection began monthly in 1968, while condo data collection began quarterly in 1981; the series were combined in 1999 when monthly collection of condo data began. Prior to this period, single-family homes accounted for more than nine out of 10 purchases. Historic comparisons for total home sales prior to 1999 are based on monthly single-family sales, combined with the corresponding quarterly sales rate for condos.
[2] Total inventory and month’s supply data are available back through 1999, while single-family inventory and month’s supply are available back to 1982 (prior to 1999, single-family sales accounted for more than 90% of transactions and condos were measured only on a quarterly basis).
[3] The median price is where half sold for more and half sold for less; medians are more typical of market conditions than average prices, which are skewed higher by a relatively small share of upper-end transactions. The only valid comparisons for median prices are with the same period a year earlier due to seasonality in buying patterns. Month-to-month comparisons do not compensate for seasonal changes, especially for the timing of family buying patterns. Changes in the composition of sales can distort median price data. Year-ago median and mean prices sometimes are revised in an automated process if additional data is received.
The national median condo/co-op price often is higher than the median single-family home price because condos are concentrated in higher-cost housing markets. However, in a given area, single-family homes typically sell for more than condos as seen in NAR’s quarterly metro area price reports.
[4] Survey results represent owner-occupants and differ from separately reported monthly findings from NAR’s REALTORS® Confidence Index, which include all types of buyers. The annual study only represents primary residence purchases, and does not include investor and vacation home buyers. Results include both new and existing homes.
[5] Distressed sales (foreclosures and short sales), days on market, first-time buyers, all-cash transactions and investors are from a monthly survey for the NAR’s REALTORS® Confidence Index, posted at nar.realtor.

Part II – from the Fannie Mae Economic and Strategic Research (ESR) Group to MHProNews is the following news release.
Recent Rate Run-Up Expected to Keep Existing Home Sales Near Historic Lows Through 2025
Economy Remains on Strong Footing, though Core Inflation Remains Sticky
WASHINGTON, DC – November 21, 2024 – Existing home sales are now expected to rise only 4 percent next year from a 2024 pace that is on track for a nearly 30-year low, according to the November 2024 commentary from the Fannie Mae Economic and Strategic Research (ESR) Group. The downward revision to the existing home sales outlook, which was previously forecast to rise 11 percent in 2025, is the result of significant upward movement in mortgage rates and other long-duration bonds in recent weeks. Whereas previously the ESR Group had expected mortgage rates to dip below 6 percent in early 2025, the revised forecast now shows mortgage rates ending 2025 at 6.3 percent and remaining above 6 percent through 2026. The ESR Group does expect a significant improvement in existing home sales of around 17 percent in its inaugural 2026 forecast, as affordability conditions improve, the lock-in effect weakens, and pent-up demand to move materializes. Furthermore, the ESR Group continues to expect new home sales to improve on already-robust levels in both 2025 and 2026, as homebuilders continue to offer buyers incentives to move existing inventories.
The ESR Group’s economic growth outlook is little changed this month, with minor upward revisions to near-term growth in personal consumption. Its 2026 GDP forecast sees the economy continuing to grow near its long-run trend rate of about 2.2 percent. Of note, the ESR Group now expects core inflation, for which further progress has largely stalled in recent months, to remain elevated in the near term. This is offset somewhat by the expectation for lower oil prices due to recent movements in oil markets and a softer global demand outlook, which will likely work to keep topline inflation measures below core inflation through 2025. The ESR Group expects core inflation to return to the Fed’s 2 percent target by the second quarter of 2026, but it now expects somewhat less monetary policy easing in 2025 than previously forecasted.
“Long-run interest rates have moved upward over the past couple months following a string of continued strong economic data and disappointing inflation readings,” said Mark Palim, Fannie Mae Senior Vice President and Chief Economist. “To the extent that the recent run-up in rates has been driven by market expectations of stronger economic growth, we think this bodes well for the labor market outlook and home purchase demand. However, we expect inventories of homes added to the market, and therefore sales of existing homes, to remain subdued through next year, as the higher mortgage rate environment is likely to strengthen the ongoing lock-in effect. How these competing forces balance out is currently an open question, but for now we continue to expect affordability to remain the primary constraint on housing activity through our forecast horizon.”
Visit the Economic and Strategic Research site at fanniemae.com to read the full November 2024 Economic Outlook, including the Economic Developments Commentary, Economic Forecast, Housing Forecast, and Multifamily Market Commentary.
About the ESR Group
Fannie Mae’s Economic and Strategic Research Group, led by Chief Economist Mark Palim, studies current data, analyzes historical and emerging trends, and conducts surveys of consumer and mortgage lender groups to provide forecasts and analyses on the economy, housing, and mortgage markets.
—
Part III – Latest Official Data Collected by the Institute for Building Technology (IBTS) for HUD on Manufactured Housing Production-Shipments by States
| Institute for Building Technology & Safety | |||||||||
| Shipments and Production Summary Report 9/01/2024 – 9/30/2024 | |||||||||
| Shipments | ||||
| State | SW | MW | Total | Floors |
| Dest. Pending | 15 | 17 | 32 | 49 |
| Alabama | 225 | 209 | 434 | 646 |
| Alaska | 1 | 1 | 2 | 3 |
| Arizona | 50 | 126 | 176 | 303 |
| Arkansas | 66 | 81 | 147 | 228 |
| California | 45 | 186 | 231 | 424 |
| Colorado | 33 | 37 | 70 | 107 |
| Connecticut | 3 | 1 | 4 | 5 |
| Delaware | 2 | 11 | 13 | 24 |
| District of Columbia | 0 | 0 | 0 | 0 |
| Florida | 179 | 412 | 591 | 1,004 |
| Georgia | 142 | 268 | 410 | 677 |
| Hawaii | 0 | 0 | 0 | 0 |
| Idaho | 9 | 19 | 28 | 48 |
| Illinois | 77 | 44 | 121 | 165 |
| Indiana | 128 | 49 | 177 | 226 |
| Iowa | 59 | 6 | 65 | 71 |
| Kansas | 56 | 8 | 64 | 72 |
| Kentucky | 137 | 196 | 333 | 529 |
| Louisiana | 279 | 140 | 419 | 562 |
| Maine | 28 | 54 | 82 | 136 |
| Maryland | 13 | 5 | 18 | 23 |
| Massachusetts | 8 | 9 | 17 | 26 |
| Michigan | 160 | 131 | 291 | 422 |
| Minnesota | 34 | 33 | 67 | 100 |
| Mississippi | 165 | 167 | 332 | 498 |
| Missouri | 54 | 51 | 105 | 156 |
| Montana | 10 | 16 | 26 | 42 |
| Nebraska | 9 | 4 | 13 | 17 |
| Nevada | 9 | 40 | 49 | 90 |
| New Hampshire | 15 | 15 | 30 | 45 |
| New Jersey | 13 | 4 | 17 | 21 |
| New Mexico | 48 | 91 | 139 | 233 |
| New York | 71 | 83 | 154 | 237 |
| North Carolina | 268 | 296 | 564 | 860 |
| North Dakota | 9 | 22 | 31 | 53 |
| Ohio | 88 | 48 | 136 | 184 |
| Oklahoma | 95 | 118 | 213 | 332 |
| Oregon | 25 | 79 | 104 | 186 |
| Pennsylvania | 66 | 90 | 156 | 246 |
| Rhode Island | 0 | 0 | 0 | 0 |
| South Carolina | 156 | 295 | 451 | 747 |
| South Dakota | 15 | 15 | 30 | 45 |
| Tennessee | 123 | 245 | 368 | 614 |
| Texas | 637 | 888 | 1,525 | 2,414 |
| Utah | 17 | 17 | 34 | 51 |
| Vermont | 8 | 8 | 16 | 24 |
| Virginia | 51 | 87 | 138 | 225 |
| Washington | 5 | 109 | 114 | 231 |
| West Virginia | 59 | 74 | 133 | 207 |
| Wisconsin | 61 | 26 | 87 | 113 |
| Wyoming | 51 | 6 | 57 | 63 |
| Canada | 0 | 0 | 0 | 0 |
| Puerto Rico | 0 | 0 | 0 | 0 |
| Total | 3,877 | 4,937 | 8,814 | 13,784 |
| THE ABOVE STATISTICS ARE PROVIDED AS A MONTHLY | ||||
| SUBSCRIPTION SERVICE. REPRODUCTION IN PART OR | ||||
| IN TOTAL MUST CARRY AN ATTRIBUTION TO IBTS, INC. | ||||
| Production | ||||
| State | SW | MW | Total | Floors |
| States Shown(*) | 167 | 274 | 441 | 719 |
| Alabama | 723 | 798 | 1,521 | 2,325 |
| *Alaska | 0 | 0 | 0 | 0 |
| Arizona | 56 | 138 | 194 | 334 |
| *Arkansas | 0 | 0 | 0 | 0 |
| California | 48 | 177 | 225 | 407 |
| *Colorado | 0 | 0 | 0 | 0 |
| *Connecticut | 0 | 0 | 0 | 0 |
| *Delaware | 0 | 0 | 0 | 0 |
| *District of Columbia | 0 | 0 | 0 | 0 |
| Florida | 68 | 206 | 274 | 476 |
| Georgia | 169 | 361 | 530 | 895 |
| *Hawaii | 0 | 0 | 0 | 0 |
| Idaho | 27 | 72 | 99 | 177 |
| *Illinois | 0 | 0 | 0 | 0 |
| Indiana | 630 | 241 | 871 | 1,112 |
| *Iowa | 0 | 0 | 0 | 0 |
| *Kansas | 0 | 0 | 0 | 0 |
| *Kentucky | 0 | 0 | 0 | 0 |
| *Louisiana | 0 | 0 | 0 | 0 |
| *Maine | 0 | 0 | 0 | 0 |
| *Maryland | 0 | 0 | 0 | 0 |
| *Massachusetts | 0 | 0 | 0 | 0 |
| *Michigan | 0 | 0 | 0 | 0 |
| Minnesota | 31 | 77 | 108 | 185 |
| *Mississippi | 0 | 0 | 0 | 0 |
| *Missouri | 0 | 0 | 0 | 0 |
| *Montana | 0 | 0 | 0 | 0 |
| *Nebraska | 0 | 0 | 0 | 0 |
| *Nevada | 0 | 0 | 0 | 0 |
| *New Hampshire | 0 | 0 | 0 | 0 |
| *New Jersey | 0 | 0 | 0 | 0 |
| *New Mexico | 0 | 0 | 0 | 0 |
| *New York | 0 | 0 | 0 | 0 |
| North Carolina | 228 | 308 | 536 | 844 |
| *North Dakota | 0 | 0 | 0 | 0 |
| *Ohio | 35 | 43 | 78 | 121 |
| *Oklahoma | 0 | 0 | 0 | 0 |
| Oregon | 31 | 189 | 220 | 416 |
| Pennsylvania | 212 | 272 | 484 | 756 |
| *Rhode Island | 0 | 0 | 0 | 0 |
| *South Carolina | 0 | 0 | 0 | 0 |
| *South Dakota | 0 | 0 | 0 | 0 |
| Tennessee | 536 | 768 | 1,304 | 2,073 |
| Texas | 872 | 992 | 1,864 | 2,858 |
| *Utah | 0 | 0 | 0 | 0 |
| *Vermont | 0 | 0 | 0 | 0 |
| *Virginia | 0 | 0 | 0 | 0 |
| *Washington | 0 | 0 | 0 | 0 |
| *West Virginia | 0 | 0 | 0 | 0 |
| *Wisconsin | 44 | 21 | 65 | 86 |
| *Wyoming | 0 | 0 | 0 | 0 |
| *Canada | 0 | 0 | 0 | 0 |
| *Puerto Rico | 0 | 0 | 0 | 0 |
| Total | 3,877 | 4,937 | 8,814 | 13,784 |
| (*) THESE STATES HAVE FEWER THAN THREE PLANTS. | ||||
| FIGURES ARE AGGREGATED ON FIRST LINE ABOVE | ||||
| TOTALS TO PROTECT PROPRIETARY INFORMATION. | ||||
| Ashok K Goswami, PE, COO, 45207 Research Place, Ashburn, VA |
Part IV – Additional Information with Focused MHProNews Analysis and Commentary
1) MHARR publicly provides a monthly report on manufactured housing data that goes back to the origins of their website at this link here. As was noted in the preface, the NAR, NAHB, or for that matter the Recreational Vehicle Association (RVIA) – among other trade groups – routinely provides monthly reports on economic activity that mainstream media may find to be of interest.
2) MHARR’s report for September, published on 11.4.2024, said the following.
MHProNews’ analysis of that are found in the report linked below.

3) The National Association of Home Builders (NAHB) recently said the following.
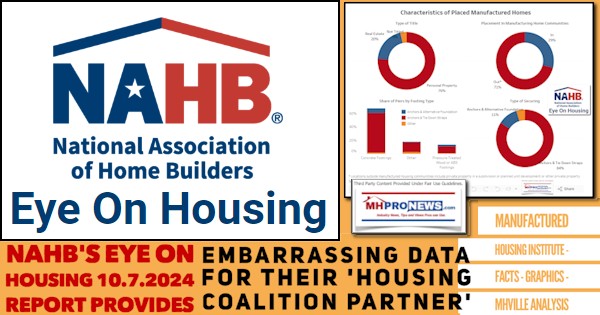
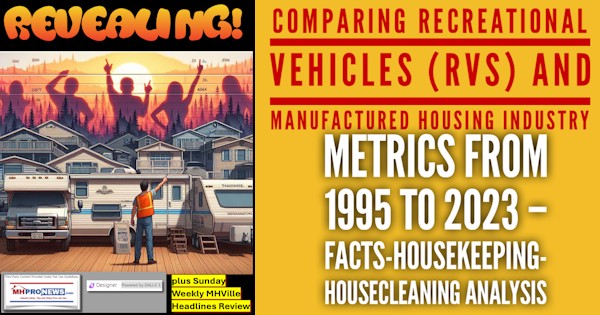
Earlier this year, MHProNews published this exclusive fact-packed report with analysis. In order to illustrate the dramatic slide of manufactured housing since 1998 vs. the overall strong rise of the RV industry, MHProNews has published reports like the one linked below.

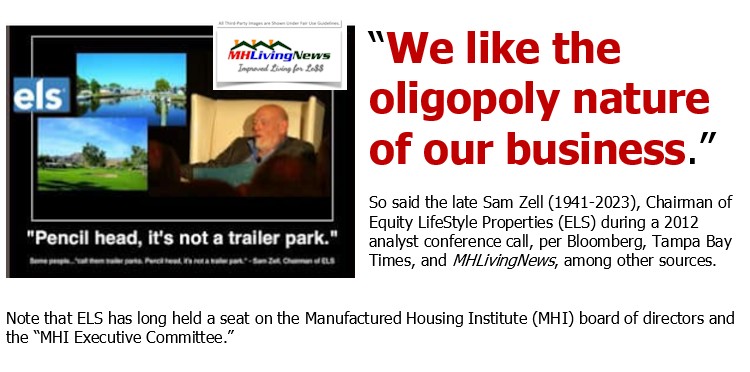
4) In a recent email to MHProNews, Big newsletter antitrust (anti-monopolist) and Goliath author Matt Stoller said this. “In June, I pointed out there are a set of companies called “economic termites,” which are “instances of monopolization big enough to make investors a huge amount of money, but not noticeable enough for most of us. An individual termite isn’t big enough to matter, but the existence of a termite is extremely bad news, because it means there are others. Add enough of them up, and you get our modern economic experience.” Stoller’s colorful description of “economic termites” could be applied to the manufactured housing industry as a lens to view 21st century market conditions through. In making such an assessment, the late Sam Zell’s words must be kept in mind.
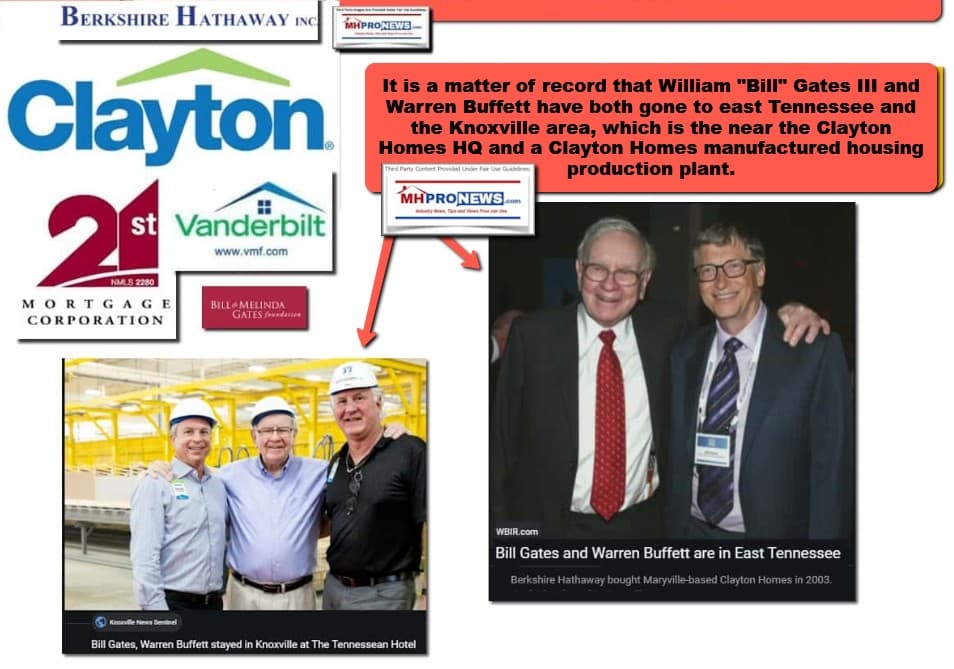
4) Antitrust advocate Stoller’s description of “economic termites” is not far from the description used by Warren Buffett ally and significant Berkshire Hathaway (BRK) investor William “Bill” Gates III, co-founder of Microsoft. Berkshire is the parent company to several well-known brands in manufactured housing. They include Shaw, Clayton Homes, 21st Mortgage Corporation, Vanderbilt Mortgage and Finance (VMF), and others.
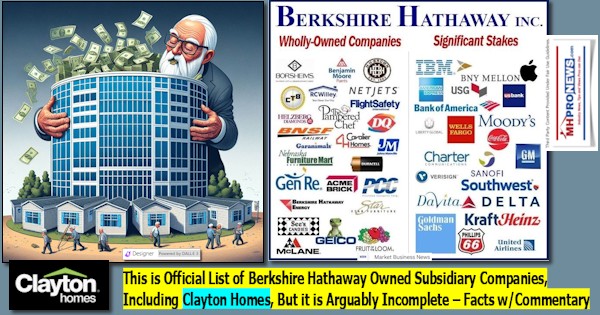
5) According to remarks offered by Gates as reported by CNBC, the currently centi-billionaire said this about Buffett’s methods. “I didn’t even want to meet Warren because I thought, ‘Hey this guy buys and sells things, and so he found imperfections in terms of markets, that’s not value added to society, that’s a zero-sum game that is almost parasitic‘”. Gates said this about his initial thoughts on meeting Warren Buffett before they became close friends and allies in several investment and nonprofit activities. Gates’ and Buffett’s politics seem to routinely align too.


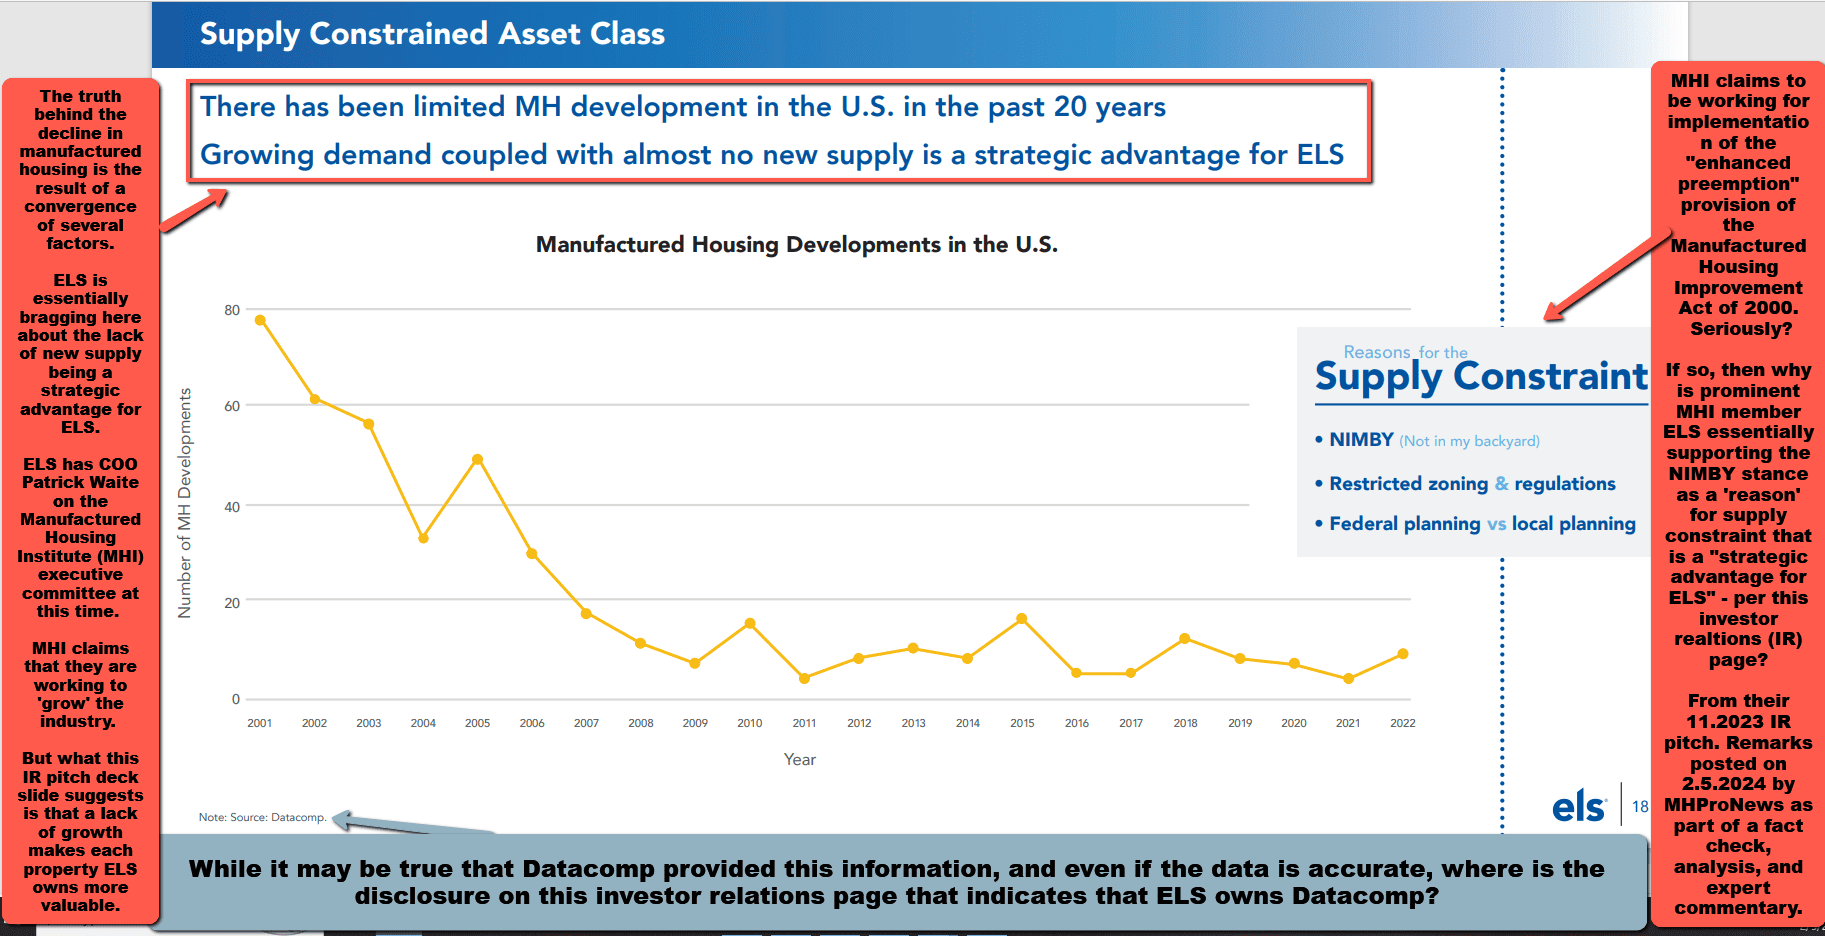
6) Larger companies view MHI as “their” trade group. With good reason. The main board of directors of MHI are and have been packed with consolidators of the manufactured home industry. The state association executives on the MHI board are similarly routinely have their state organization dominated by several of those same consolidation-focused brands. MHI has ducked accountability on the evidence-based concerns raised by critics of the trade group that are backed up by evidence from publicly traded companies’ own statements during earnings calls or in documents such as their investor relations (IR) presentations. Some examples? The Equity LifeStyle Properties (ELS) late chairman Sam Zell quote above (Part IV #4) was made during an earnings call, and the items below are earnings call or IR pitch graphics. The stated or implied point of the first several IR presentation graphics that follow is that lack of developing is a benefit to their investment thesis. While that is a debatable stance, as UMH Properties (UMH) has made a strong evidence-based argument in the opposite direction in favor of increased developing and sales, nevertheless what the illustrations and statements that follow reflect are clues hiding in plain sight that seem to explain much of MHI’s curious behavior when compared to MHARR, NAR, NAHB, or the RVIA. It could be summed up like this.
Given that many of the Manufactured Housing Institute’s major members of the Arlington, VA based trade group are focused on consolidation vs. growth, why should it be a surprise that MHI is failing to take pro-growth-oriented behaviors?
So, what has been occurring in manufactured housing for years is steady consolidation. These are where the terms ‘termites’ and ‘parasitic’ behavior used by Stoller and Gates could be insightful. Instead of working toward growth and authentic innovation, what is seen instead is behavior that thwarts those goals and thus results in exits and closures that create opportunities for consolidators to move in. Meanwhile, MHI provides lip service to efforts such as getting the Manufactured Housing Improvement Act of 2000 (a.k.a.: MHIA 2000, MHIA, 2000 Reform Act, 2000 Reform Law, etc.) and its “enhanced preemption” provision. Similarly, MHI periodically has a public statement made in favor of getting the Duty to Serve (DTS) manufactured housing mandated by the Housing and Economic Recovery Act (HERA) of 2008. Examples of those concerns from some key MHI members are shown below.
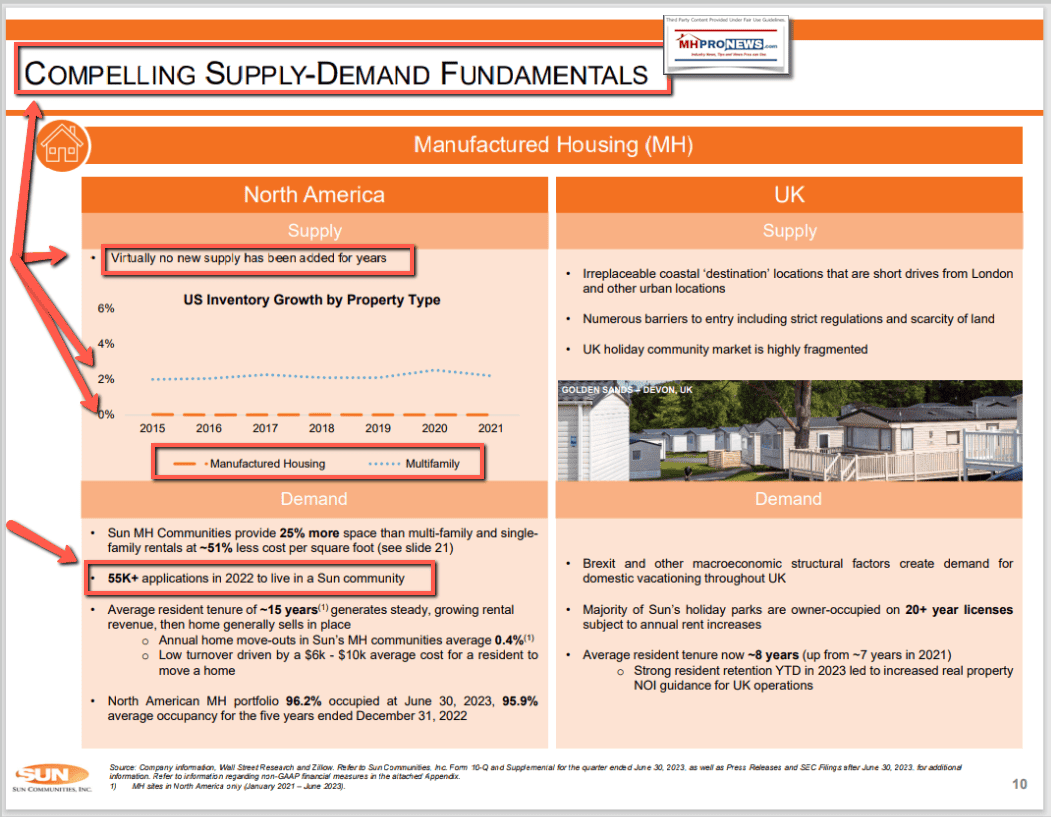
Note that several of these illustrations can be opened to reveal a larger size. Depending on your device or browser, click the image, and follow the prompts to make the image larger. Note that ELS (the first illustration) says “Supply Constrained Asset Class” and that “Supply Constraints,” including NIMBYism, restricted zoning and regulations, have yielded “growing demand coupled with almost no new supply” which “is a strategic advantage for ELS.” This is a self-declared view of ELS that is mirrored by Sun Communities (SUI), which has repeatedly made a similar “Compelling Supply Demand Fundamentals.” Sun is celebrating that multifamily housing is building at a brisk clip while manufactured housing developing has been falling since 2000 and has remained low for years. Both ELS and Sun hold MHI board positions.
Similarly, Cavco Industries (CVCO) and Skyline Champion (SKY, recently renamed Champion Homebuilders) have said that mergers and acquisitions (M&A or consolidation) is a focus for them.
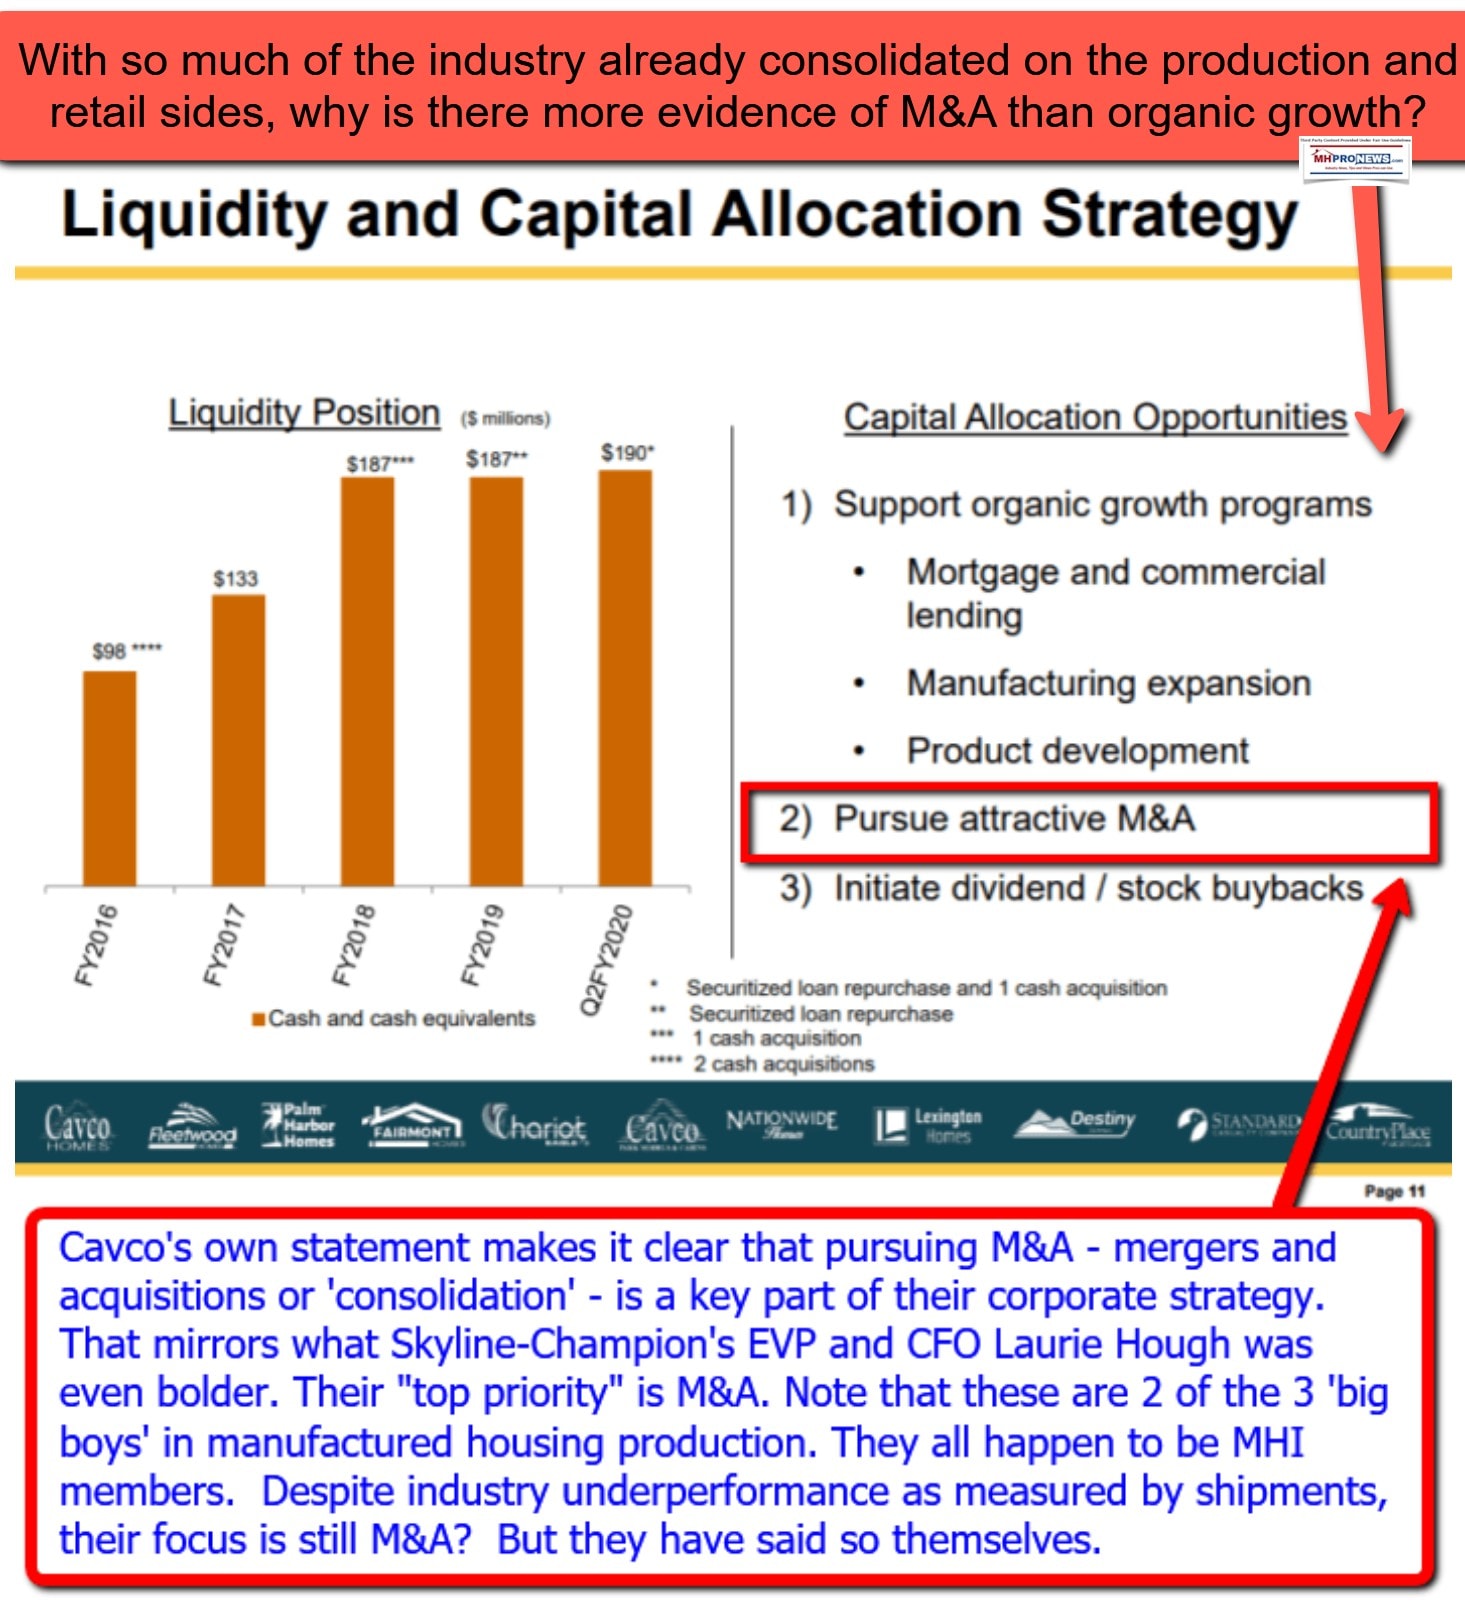

7) So, while mainstream media and some researchers have made much of the consolidation of the industry on the manufactured home community (MHC) side (a.k.a., often errantly, called “trailer parks” or “mobile home parks”) of the industry and how that has harmed consumers, there doesn’t seem to be the same level of interest in recent years to what occurred on the production and retail side. There was attention paid by the left-leaning Atlantic, for example, to the report issued by IBIS World. But that was over 13 years ago. Since then, there has been scant coverage of the dramatic loss of retailers. Other than op-eds by this writer for MHProNews in mainstream media or press releases by MHARR on parallel topics, there has been scant interest by mainstream media. Some may muse. Why is it that the obviously troubling implications this pattern has for smaller businesses and consumers of affordable housing has not been clearly and consistently called out by public officials, or by more in the media or across the left-right media spectrum?

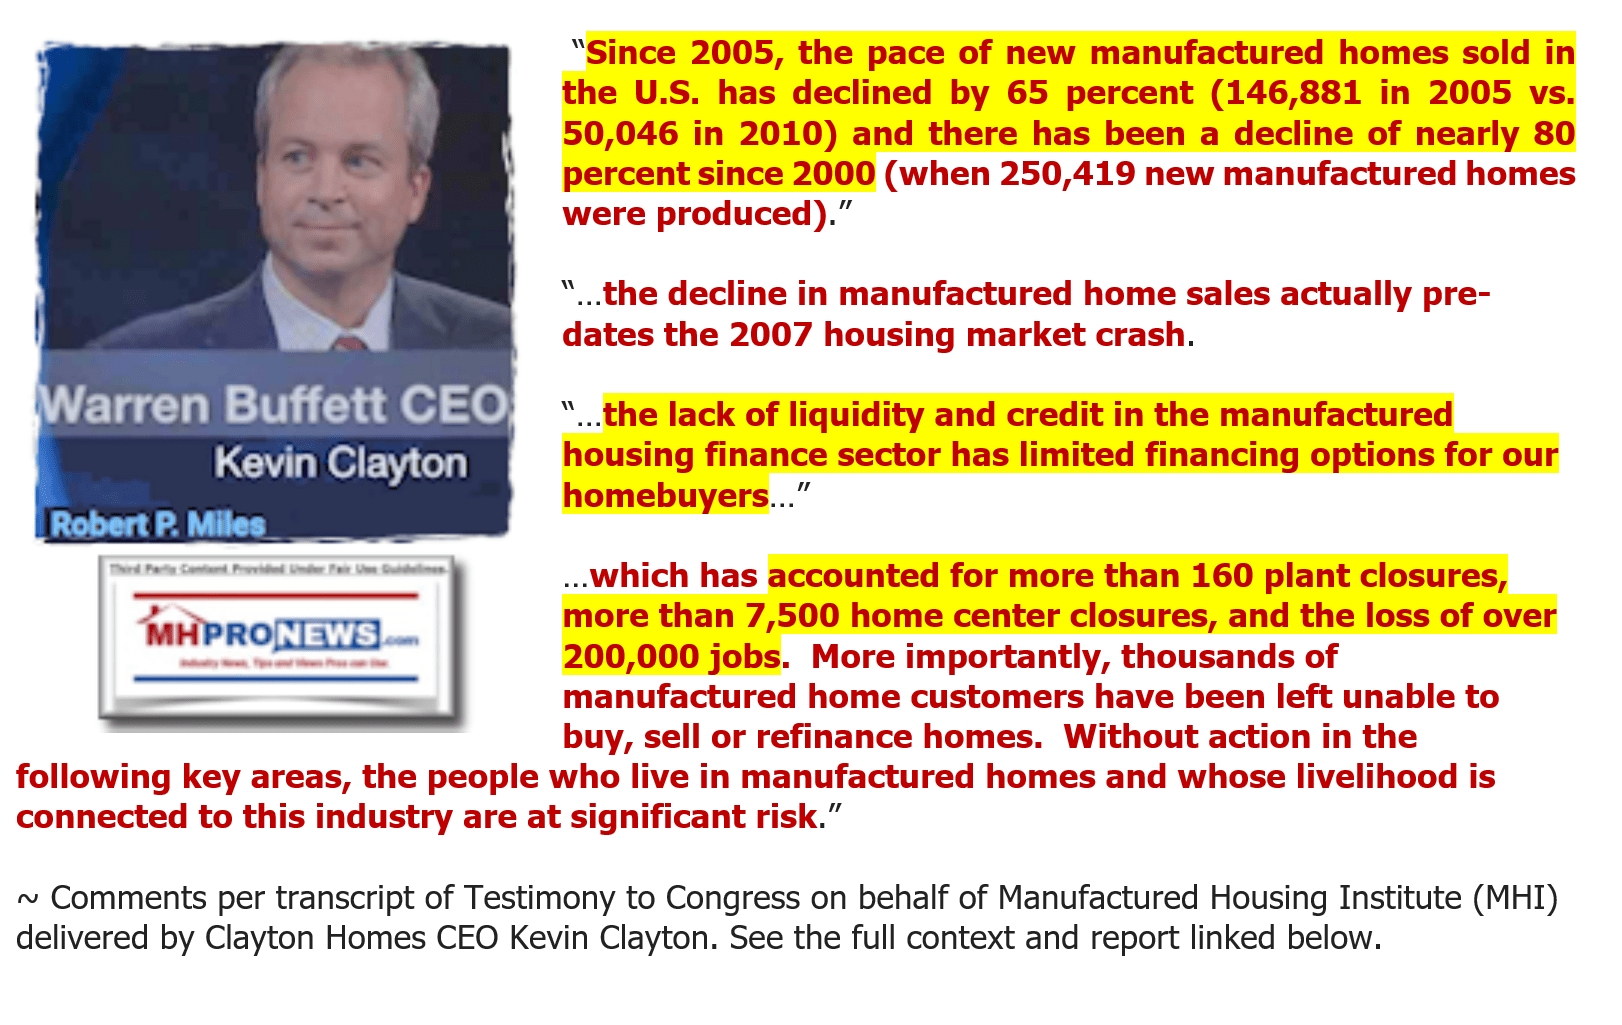
Let’s further illustrate that report by the Atlantic. Berkshire Hathaway owned Clayton Homes’ CEO Kevin Clayton spoke to Congress on behalf of MHI under “Truth in Testimony” certification. Clayton admitted some 13 years ago that by that point in time the industry had witnessed a meltdown of retailers, along with roughly half of the total production of HUD Code manufactured homes. Many of the survivors of that meltdown ended up owned by Clayton, Champion Homes, or Cavco Industries (sometimes called the Big 3 or the Big Three Cs).
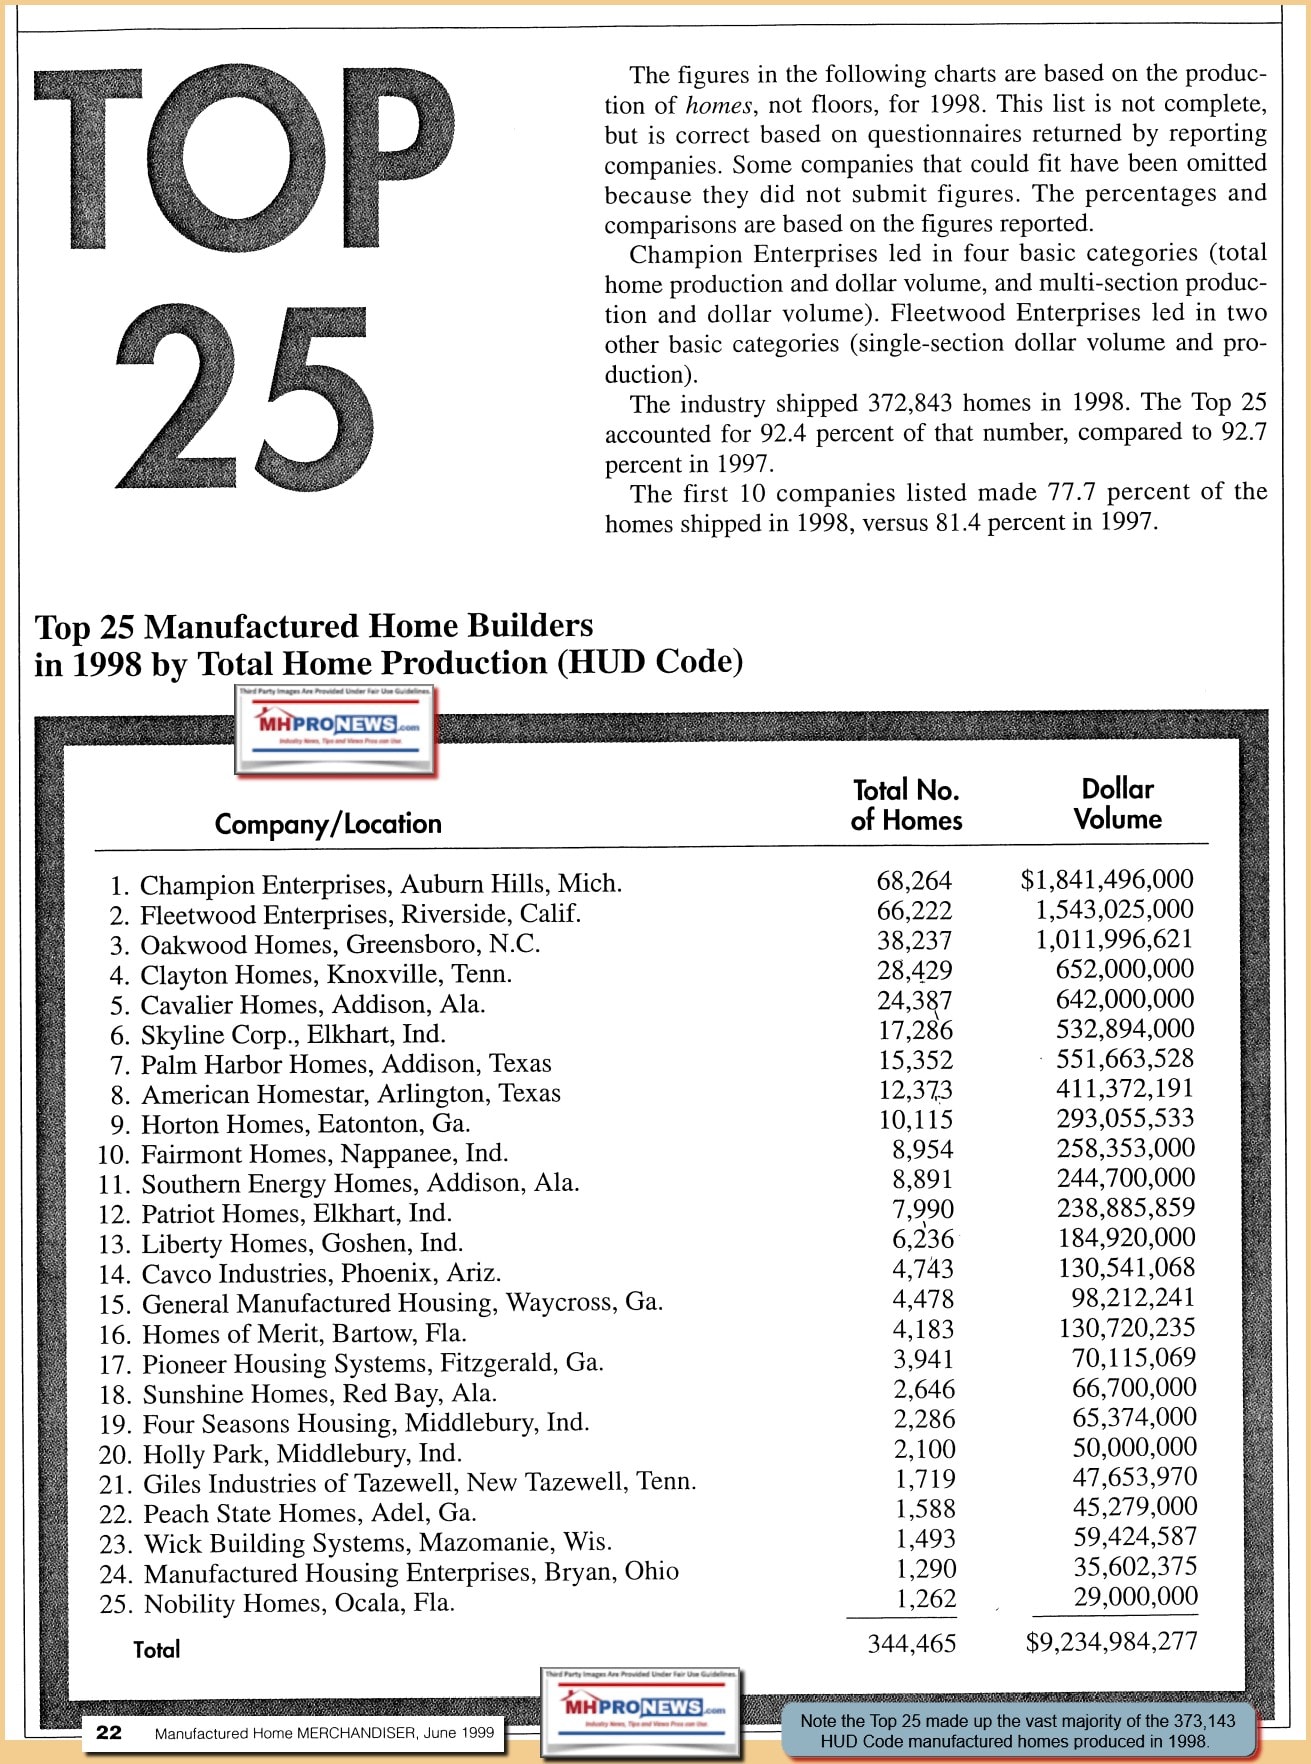
Once large firms either ended up going bankrupt, with some closing, others reorganizing and/or becoming a subsidiary of the modern Clayton, Champion, or Cavco.
8) What Clayton didn’t say in his testimony to Congress about the impact that Clayton’s sister brand, 21st Mortgage Corporation, had on the meltdown of manufactured housing. While it is widely understood that manufactured housing was crippled by a loss of third-party lenders, scant attention is paid to the fact that Buffett-led Berkshire dumped shares in Fannie and Freddie at about the time of early meltdown in manufactured housing. Is there linkage in that illustration and what followed? That is a subject worthy of independent and earnest investigation.
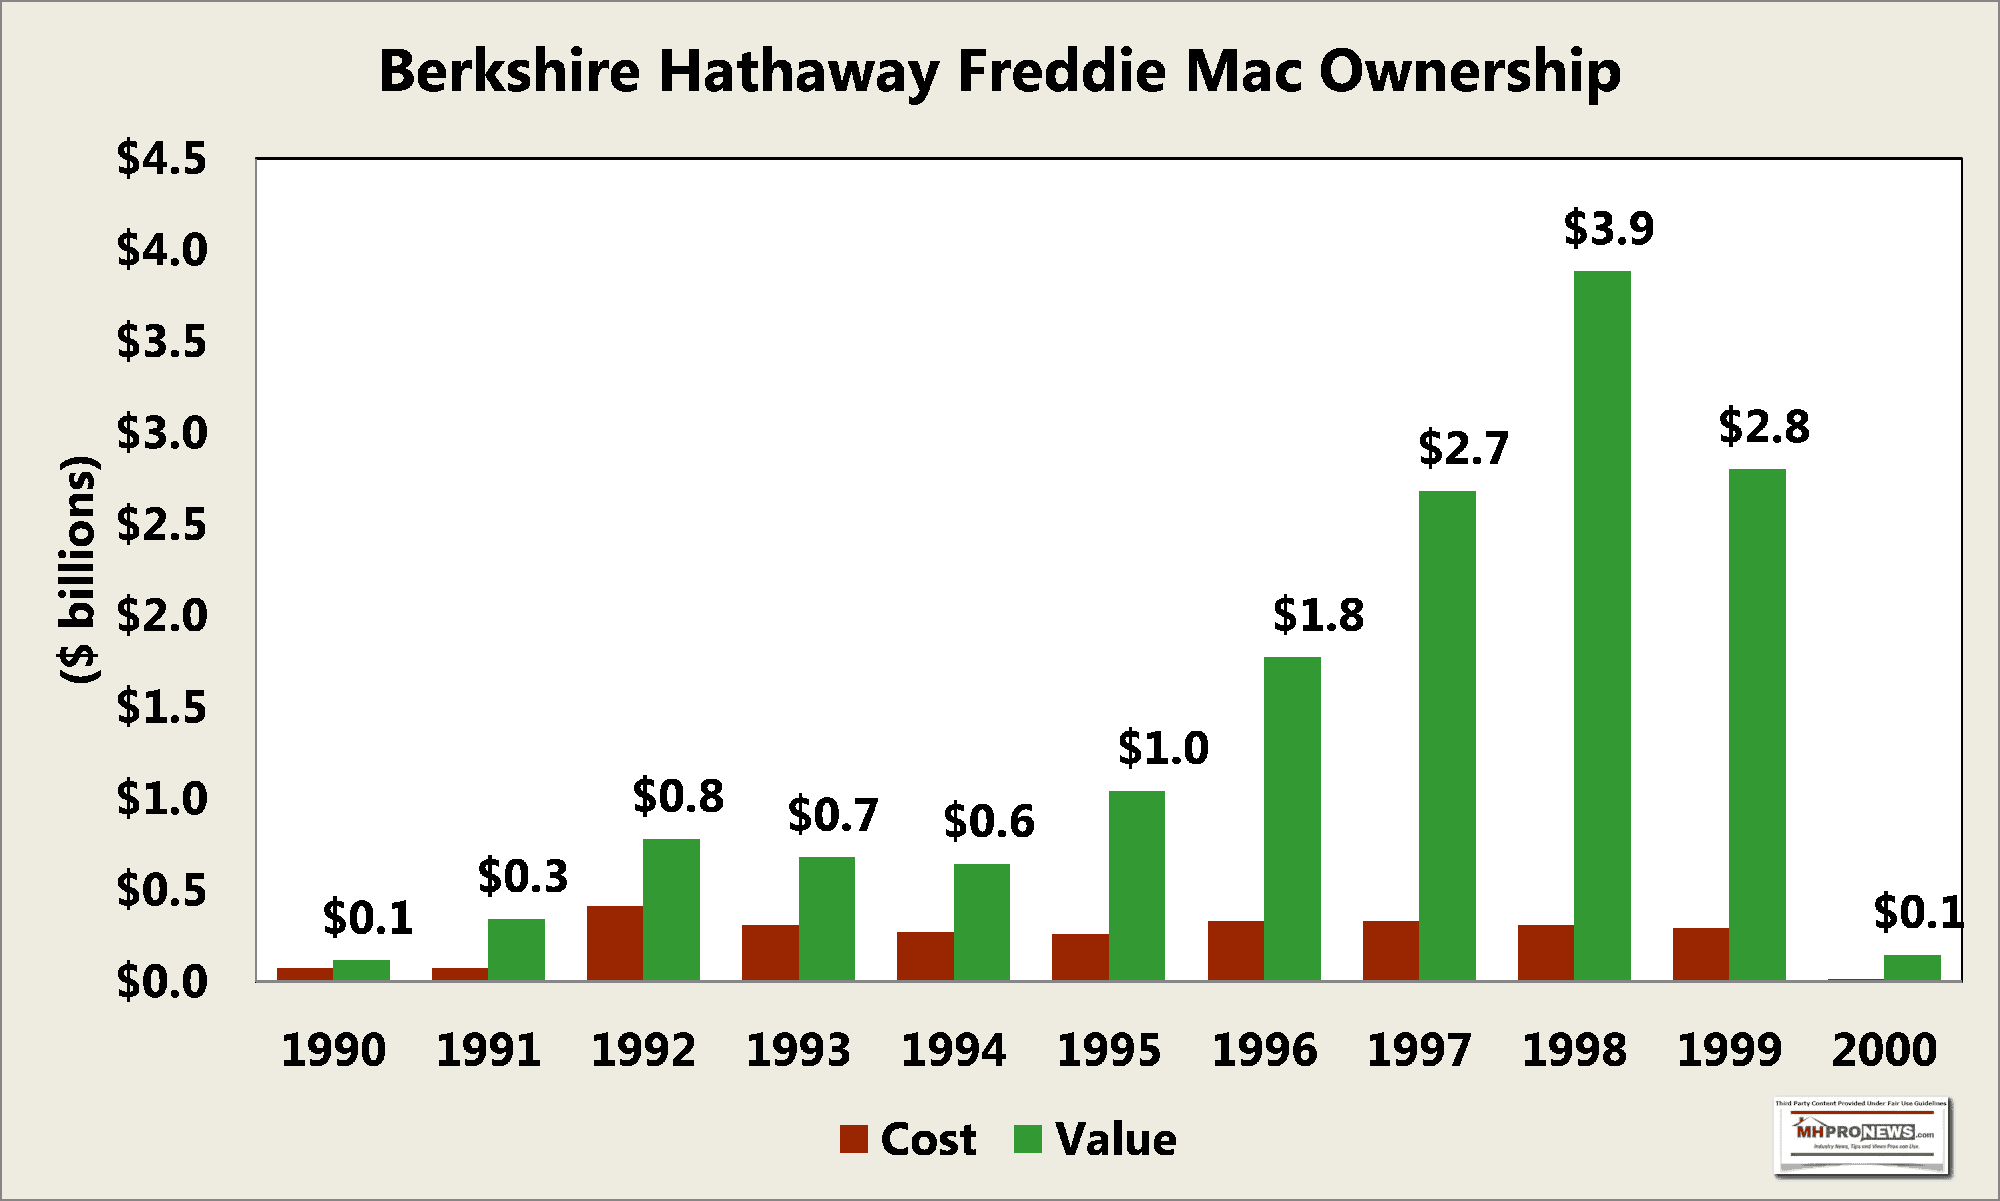
But what is known is that Buffett personally understood the connection between the lack of Fannie Mae/Freddie Mac financing and the constraints that placed on manufactured housing.

What is also known, thanks in part to reporting by Fast Company, is that the tale told by the Claytons and Buffett about how Berkshire came to own Clayton Homes is dubious.

9) To apply the verbiage of Stoller and Gates that should raise concerns that “termites” and ‘parasitical’ behavior helps explain why manufactured housing dramatically experienced a crash following 1998 from which it has obviously never recovered, there is also the research of Minneapolis Federal Reserve Senior Economist James A. “Jim” Schmitz Jr. and his colleagues who have built over the course of years evidence of what they called “sabotaging monopoly” tactics. The base illustration below is from Skyline Champion (SKY, now Champion Homes). The annotations and arrows added are by MHProNews.
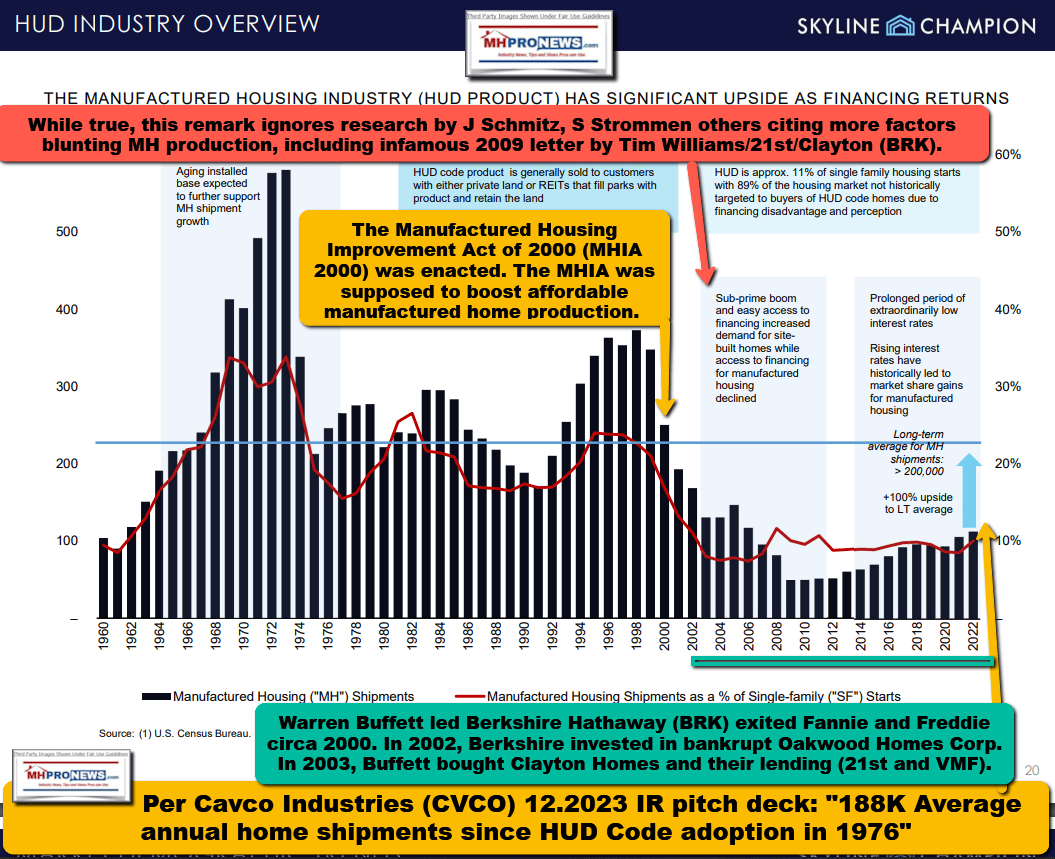
One of the points raised by Schmitz and his colleagues is that spotting sabotage monopoly tactics is often challenging. Those researchers clearly connect the lack of affordable manufactured homes with increased homelessness and poverty.

10) MHProNews/MHLivingNews have periodically featured the research by the economists into sabotage monopoly tactics in conjunction with their colleagues, in reports like those cited above. By contrast, until fairly recently, MHI and their aligned bloggers and trade publishers have largely ignored them. When MHI finally mentioned Schmitz, it was to publicly slam him. Coincidence?
11) Let’s do a mini-summary of the above before pivoting to more relevant evidence about key companies and figures involved at MHI that shed light on why the industry is underperforming during an affordable housing crisis.
- a) MHARR, NAR, NAHB, and the RVIA all do certain things to promote their respective industries, which include (but are not limited to) publishing monthly national data. By contrast, MHI fails to do that and arguably also fails to do numbers of things that ought to be common sense for a trade group that claims to be promoting and defending the manufactured home industry.
- b) Antitrust researcher Stoller has described what is happening in several parts of the economy as “termites” style behavior. That is perhaps similar to what Buffett-ally and significant Berkshire investor Bill Gates has described ‘parasitic’ behavior that Buffett exploited to his own benefit.
- c) Minneapolis Federal Reserve Senior Economist Schmitz and his colleagues have described a method that they assert has been used against manufactured housing as ‘sabotage monopoly’ tactics.
- d) The manufactured home industry has consolidated dramatically since 2000. Many once dominating companies have either become subsidiaries and/or are part of reorganized brands. Other firms have vanished altogether.
- e) An evidence-based case can be made that the lack of affordable manufactured housing production in the 21st century is similar to the total number of housing units that the U.S. needs.


- f) As the ‘aha’ light of tips, evidence, and apparent patterns of behavior began to emerge, this publication went from being praised and embraced by MHI leaders to being stonewalled, purportedly blacklisted, ducked and shunned. While that has been painful in certain ways for MHProNews and our sister site, it may well prove to be useful to the manufactured home industry in the longer run. Why? Because, MHI can’t easily square the evidence presented, like the examples shown herein above and below, by saying that we are presenting erroneous information. We have been praised by higher profile corporate and industry leaders precisely for being factually accurate and objective. For example, while Jennison was reportedly pushed by Tim Williams into making the remarks of praise video captured and shown below, it nevertheless exists as a reminder of the big pivot by MHI leaders from praising us to attempting to pretend that MHProNews (or for that matter, MHARR), don’t exist. MHI has taken a similar tactic of turning into “unpersons” that are “memory holed” some of their own prior presidents, CEOs, VPs or once-praised researchers among others. When MHI has a source or statement that becomes an embarrassment, it seems that they
12) But these companies that are often near the center of influence and power at the Manufactured Housing Institute (MHI) are also firms that arguably have a history of problematic behavior. Some examples will serve to illustrate. In reviewing these statements, facts, and data, one should keep in mind that paltering, posturing, the illusory effect (more here), and the big lie should be kept in mind. MHI invests effort to appear to be praiseworthy, but it is the closer look (for example, at their IRS form 990) that reveals troubling realities.
- a) Clayton Homes and their related lending, 21st Mortgage Corp and Vanderbilt Mortgage and Financing (VMF).
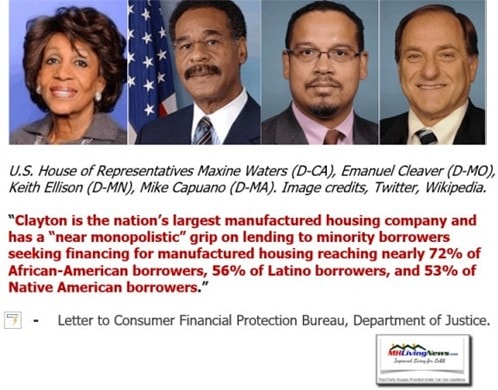
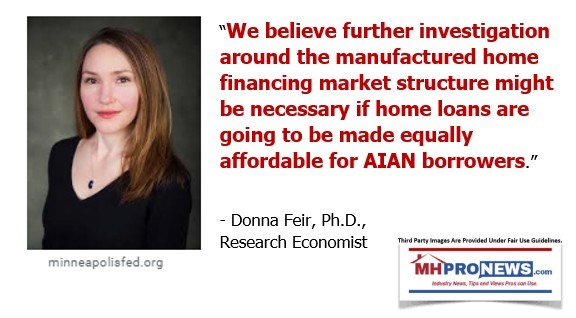


Those claims include multiple sources that directly or indirectly allege antitrust violations. According to Knudson Law legal researcher Samuel Strommen, Clayton and 21st are guilty of tying. Again, several items in this post are available in a larger size for easier reading/viewing. Depending on your device or browser, click the image and follow the prompts to increase the size. But another option is to download the image and then open it in a larger size.
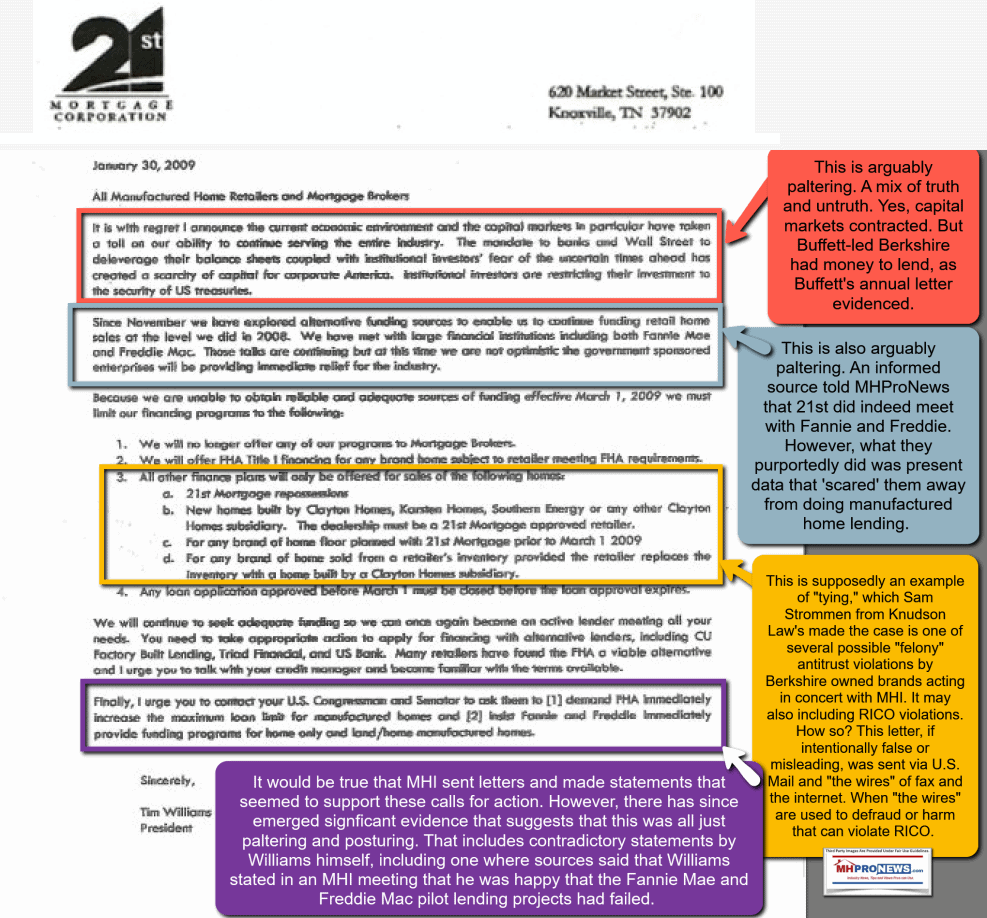
With the letter above in mind, consider Warren Buffett, Kevin Clayton, and Clayton attorney Tom Hodges have all spoken about “the Moat.”




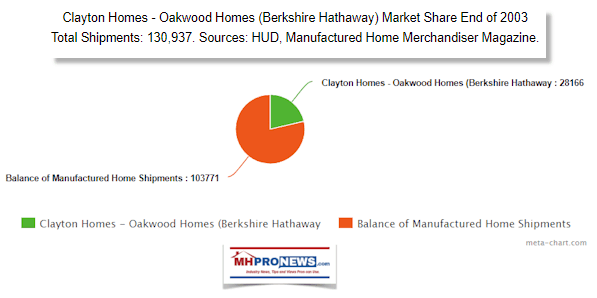
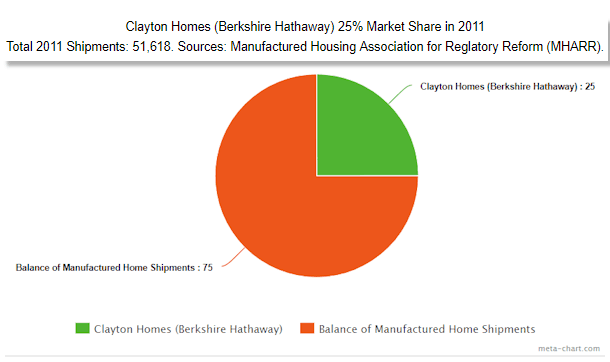
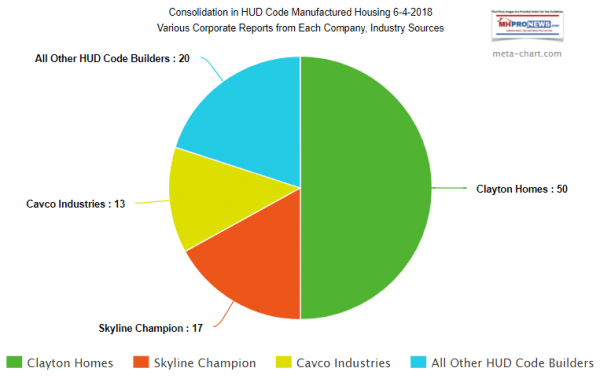
The next chart is Clayton’s market share of production 2 years after the 21st letter, shown above.
By 2018, Clayton had moved to about 50 percent market share.
When asked about Clayton’s business practices in the light of the troubling Seattle Times series, Buffett defended them.

These have been described as prima facie antitrust evidence against Clayton and MHI has arguably ignored their own antitrust guidelines in allowing these developments to occur without blowing the whistle.


- b) Cavco Industries was led for years by Joseph “Joe” Stegmayer, a former Clayton Homes division president. Stegmayer also served as a MHI chairman of the board. Curiously, Stegmayer was not asked to step down from his prior position as MHI chairman when Cavco was hit by a probe followed by a legal action launched by the Securities and Exchange Commission (SEC) that cost the firm millions and for which Stegmayer, Cavco, and others paid fines/settlements.

The case pleadings from the SEC case (linked above) reads a bit like a novel. Cavco’s leaders used various maneuvers to learn what they could about possible acquisitions. Recall that M&A was ranked highly by Cavco in their IR pitches and in earnings call remarks.



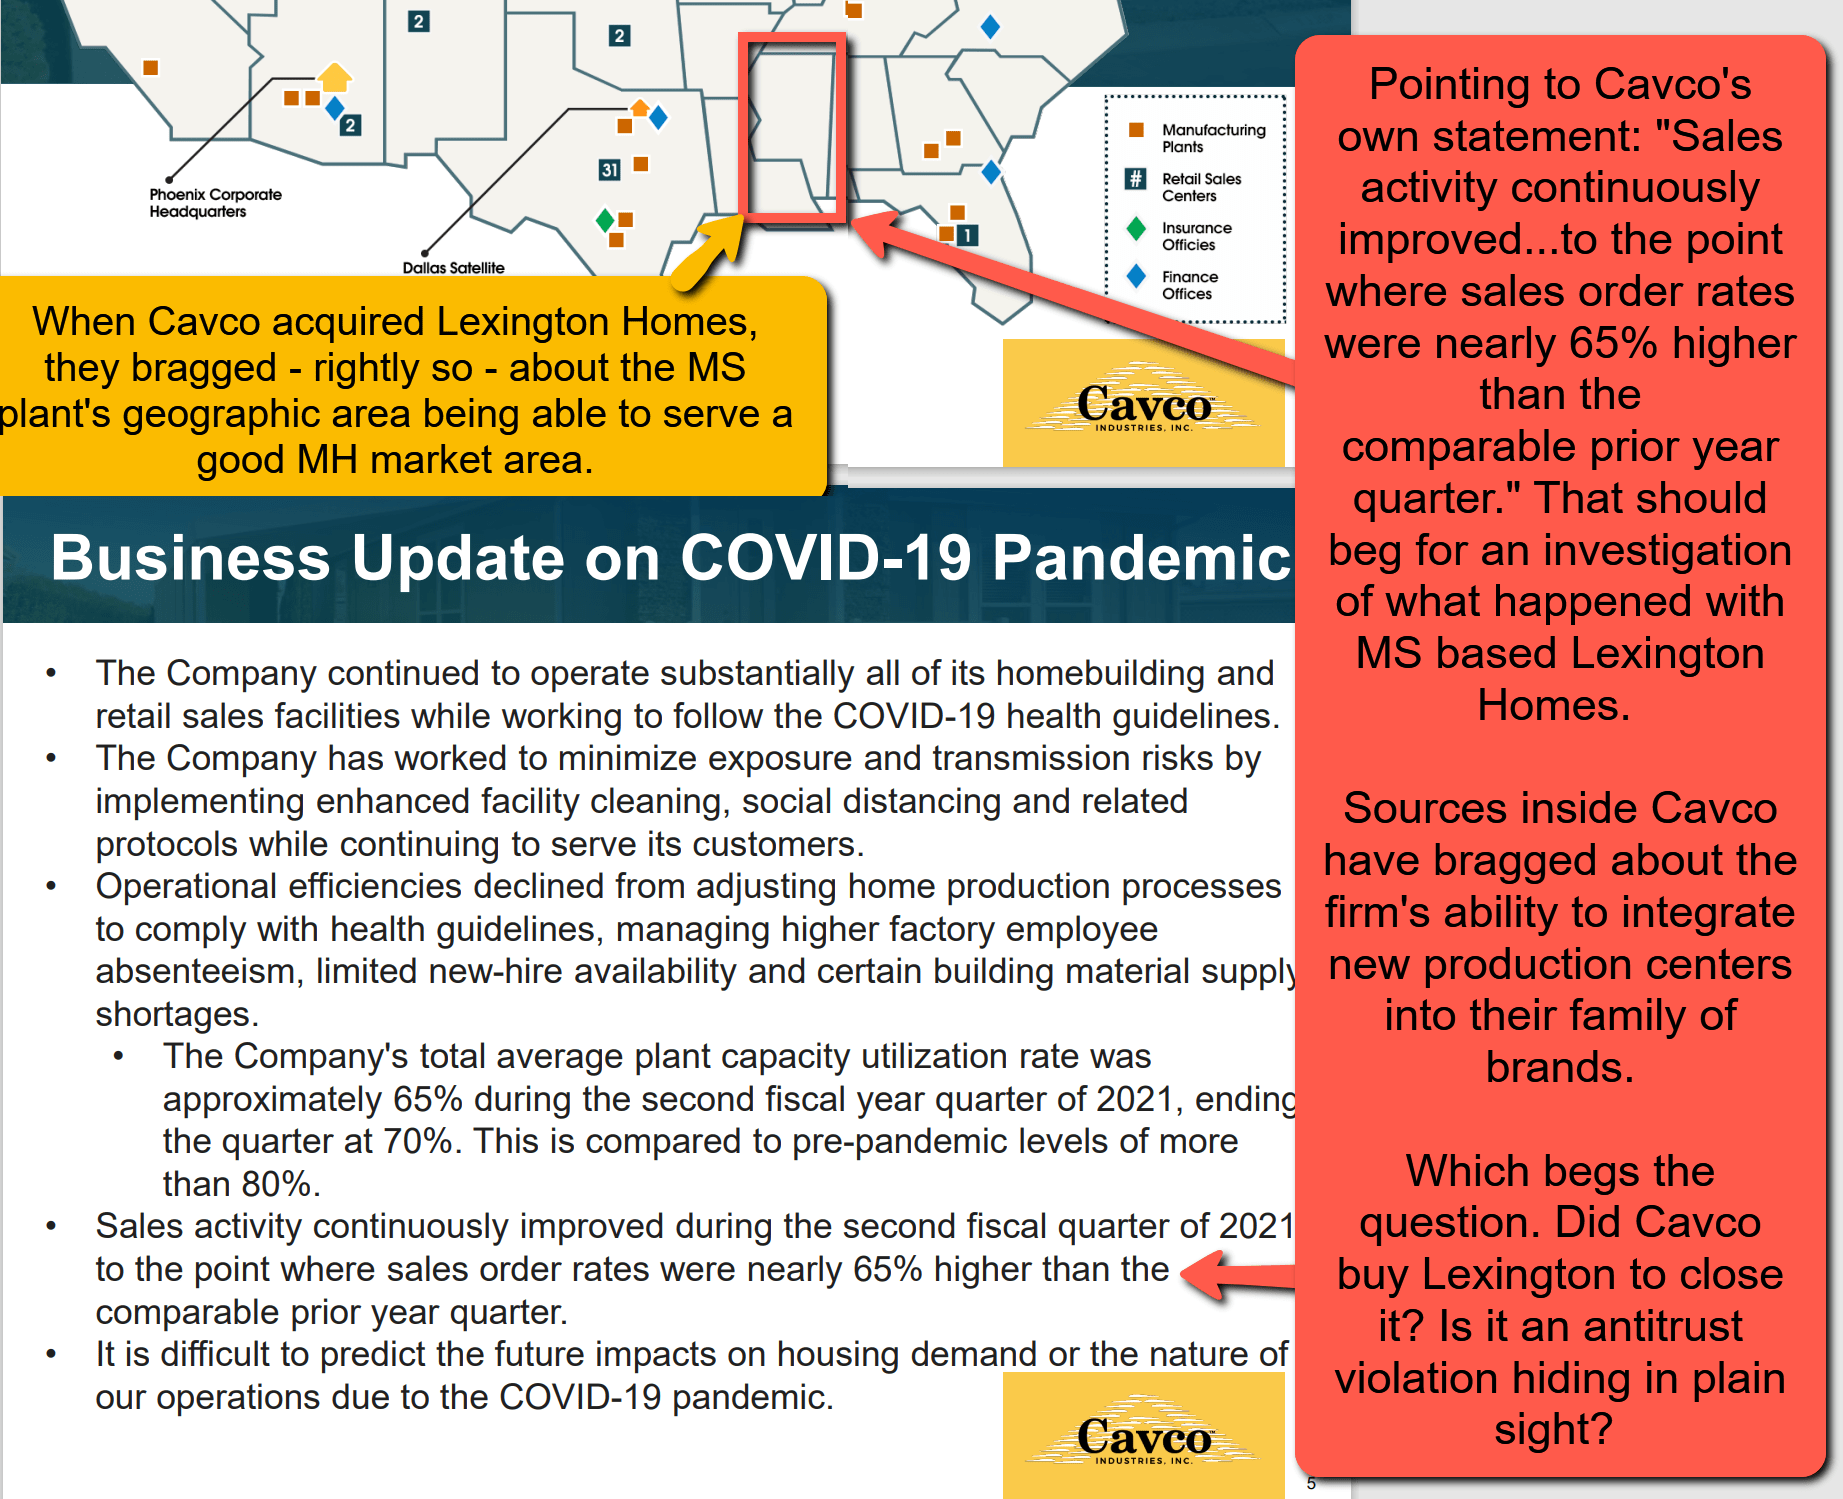
Cavco has been questions about their acquisition of Lexington Homes if it was a “killer acquisition,” a purchase meant to eliminate a competitor. CVCO bragged about the purchase but then claimed that they couldn’t make it work. Yet, the location was in one of the better market areas of the U.S. for manufactured housing production and sales. Killer acquisition are possible antitrust violations. Note the image below is available in a larger size.


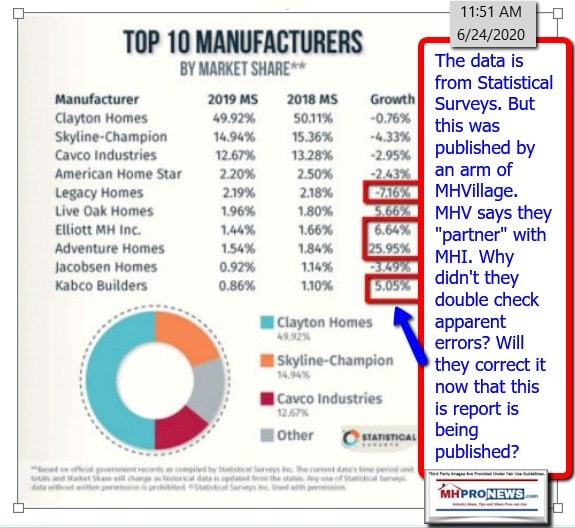
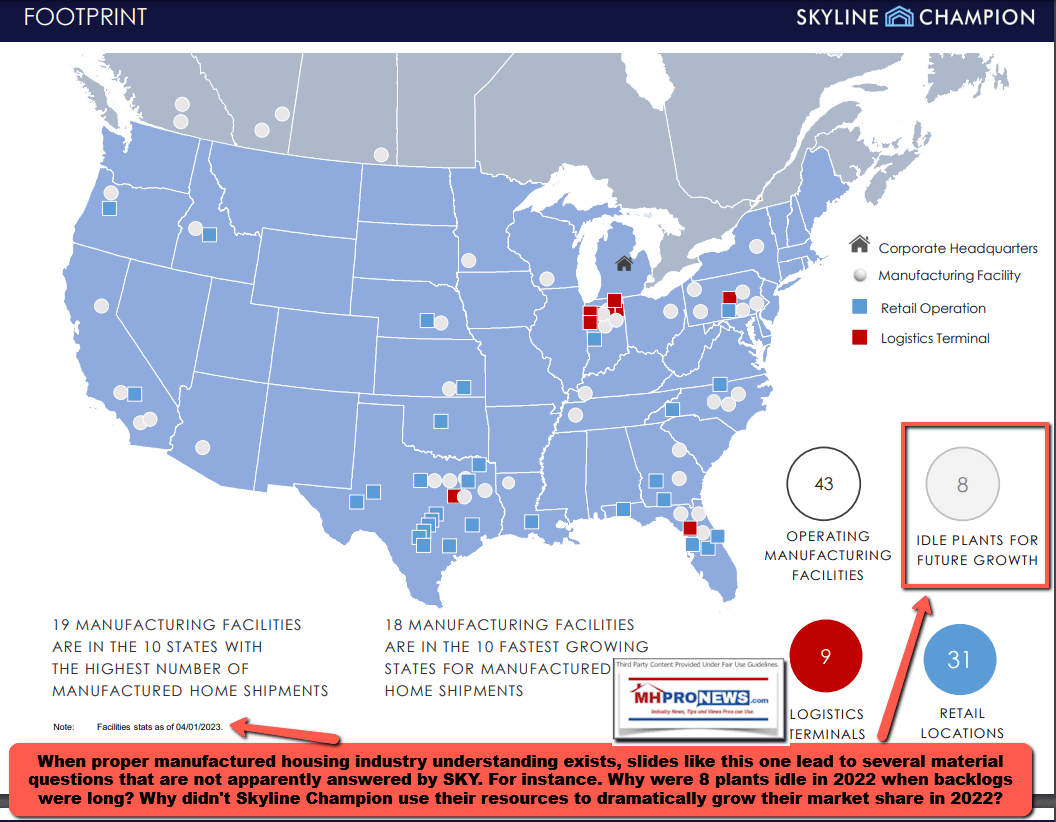
- c) Skyline Champion (SKY, now Champion Homes) was named by Knudson Law consumer and antitrust researcher Samuel “Sam” Strommen as giving apparent cover to fellow MHI member Clayton Homes in their own investor relations (IR) presentation when they apparently understated Clayton’s market share.

MHInsider published an article that featured apparently inaccurate information on market share. MHInsider is part of MHI ‘endorsed’ MHVillage, which was since purchased by MHI member Equity LifeStyle Properties (ELS).



Skyline Champion was continuing to acquire businesses even though they have idled plants.

- d) Equity LifeStyle Properties, ELS owned Datacomp, Sun Communities, RHP Properties, Yes! Communities, Hometown America, and other MHI members are among those named in several national class action antitrust suits. There has been a move to consolidate those cases. Some defendants who are not MHI members may be members of MHI linked state associations. Datacomp is a sister brand to now ELS owned MHVillage/MHInsider.



Among the curiosities involving MHI members is the fact that several appear to violate their so-called Code of Ethical Conduct with impunity.

MHI members Frank Rolfe and Dave Reynolds have also been accused of predatory practices and have boldly tossed about the term monopoly and moat.


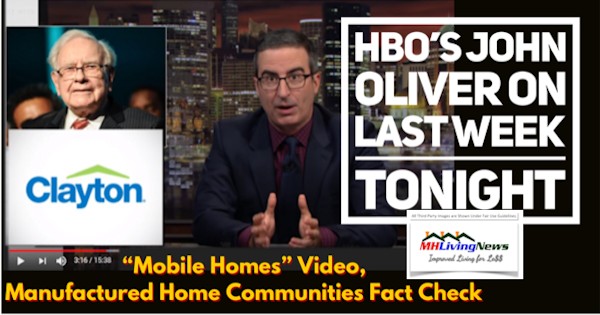
A fact-check by MHLivingNews revealed that every firm that John Oliver spotlighted in his viral satirical hit against manufactured housing has/had ties to MHI.
While Rolfe has blasted MHI at times, he has also blasted Nathan Smith, a prominent MHI member. It should be kept in mind that some people/organizations palter and project onto others what they themselves are also guilty of doing.


Nathan Smith reportedly had Senator Sherrod Brown (OH-D) on his speed dial. Among the amazing tricks of the trade seem to be MHI’s use of awards and recognition for those who in several cases are accused of problematic business practices.



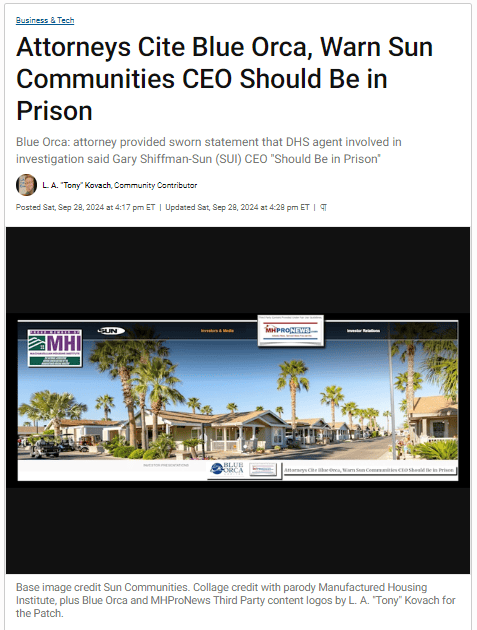
13) Despite his own tarnished image, Rolfe from time to time says something that is demonstrably grounded in evidence. For example, Rolfe said that there is no serious desire by “special interests” in solving the affordable housing crisis. He has faulted MHI on video and in writing.


14) MHARR leaders have publicly pointed their finger at MHI and their insider brands for years for thwarting the industry’s potential.



Speaking of MHI CEO Lesli Gooch, Ph.D., it is almost unimaginable that MHI leaders tasked with hiring a new team member could have failed to stumble across the pages of problematic claims about her and her controversial behavior.
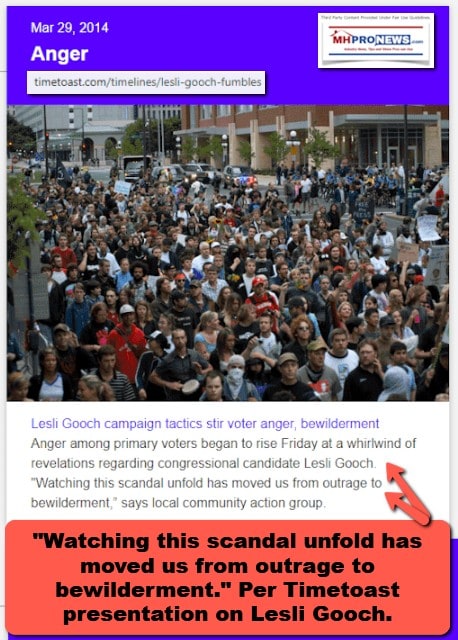


It is almost as if Gooch was hired for her problematic and conflict-of-interest allegations laden experience. How does MHI counter that evidence? By not responding to inquiries and by getting Gooch nominated as being almost a person of influence.


15) In the light of the above, the reports with analysis linked below with more third-party concerns and evidence take on a new light and potential meaning. Strommen, for example, has said that MHI is arguably guilty of “felony” antitrust violations.
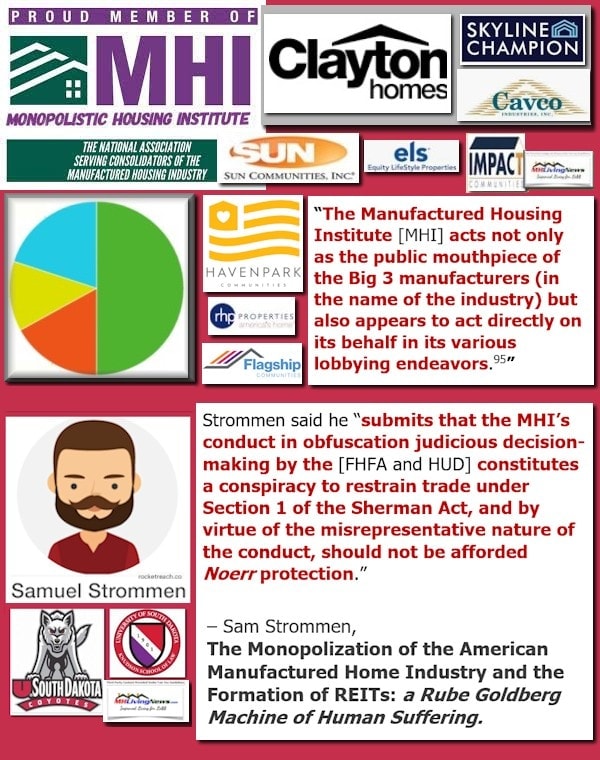





16) Given years of evidence of legal, regulatory, litigation, and media-reported controversies, one wonders how some researchers have failed to notice these patterns as part of their research into why manufactured housing is underperforming during the 21st century?
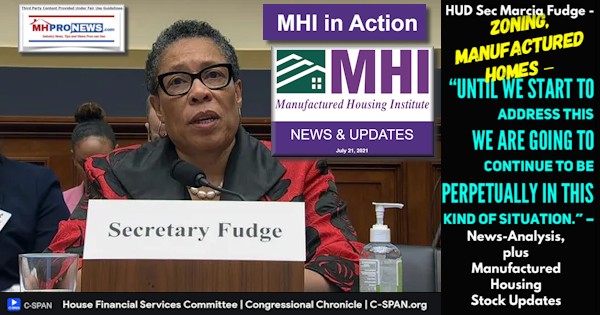
Will incoming Trump Administration officials probe these concerns as they seek to advance the cause of economic growth and the lack of affordable housing?

that the industry ought to expect this current downturn because more expensive site-built housing is also in a downturn? MHI’s research and reasoning are arguably a classic example of PALTERING and the use of a RED HERRING logical fallacy. Note: depending on your browser or device, many images in this report and others on MHProNews can be clicked to expand. Click the image and follow the prompts. For example, in some browsers/devices you click the image and select ‘open in a new window.’ After clicking that selection, you click the image in the open window to expand the image to a larger size. To return to this page, use your back key, escape or follow the prompts.
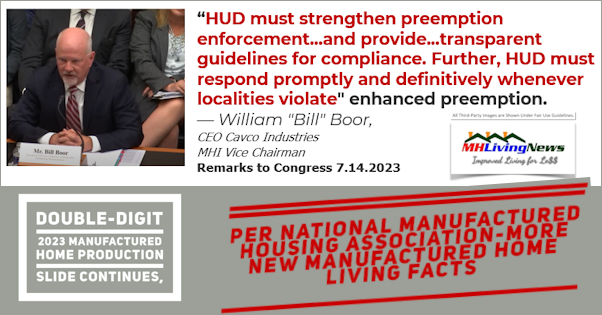



Another research item has emerged from third-parties looking into affordable manufactured housing. Watch for our planned report.


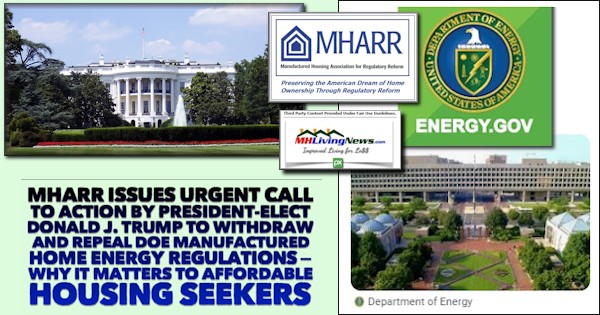
MHARR said in a message to MHProNews that they look forward to working with Trump’s HUD nominee Eric Scott Turner for the full implementation of the 2000 Reform Act. More to come. ##

An hour or so of reading a day can make the realities of your life and options and obstacles clearer. That’s a fraction of what Warren Buffett reportedly does in reading. No one connects the dots in MHVille like MHProNews and MHLivingNews. Who says? Competitors. Manufactured home industry outsiders, but also from MHVille insiders. But we have also added insights from AI fact checks and analysis, see the report linked here as an example. https://www.manufacturedhomepronews.com/artificial-intelligence-answers-why-manufactured-housing-has-underperformed-in-21st-century-during-affordable-housing-crisis-facts-analysis-plus-sunday-weekly-mhville-headlines-r/




Again, our thanks to free email subscribers and all readers like you, as well as our tipsters/sources, sponsors and God for making and keeping us the runaway number one source for authentic “News through the lens of manufactured homes and factory-built housing” © where “We Provide, You Decide.” © ## (Affordable housing, manufactured homes, reports, fact-checks, analysis, and commentary. Third-party images or content are provided under fair use guidelines for media.) See Related Reports, further below. Text/image boxes often are hot-linked to other reports that can be access by clicking on them.)

By L.A. “Tony” Kovach – for MHProNews.com.
Tony earned a journalism scholarship and earned numerous awards in history and in manufactured housing.
For example, he earned the prestigious Lottinville Award in history from the University of Oklahoma, where he studied history and business management. He’s a managing member and co-founder of LifeStyle Factory Homes, LLC, the parent company to MHProNews, and MHLivingNews.com.
This article reflects the LLC’s and/or the writer’s position and may or may not reflect the views of sponsors or supporters.
Connect on LinkedIn: http://www.linkedin.com/in/latonykovach
Related References:
The text/image boxes below are linked to other reports, which can be accessed by clicking on them.’


