US-50 State Manufactured Housing Production-Shipment Facts-Cost$ per Feds w/Conventional Housing Comps – SS Price Doubled Since 2014-Fell 3% Since 2022; plus Sunday Weekly MHVille Headline Recap
While the progress towards a ‘more perfect Union’ envisioned by the U.S. Constitution is apparently uneven, events this past week may have brought the Republic at least a step or two towards that noble aspiration. SCOTUS – the Supreme Court of the United States – handed down their much-anticipated Loper Bright ruling. Another interesting and potentially hopeful development last week is explored in the post Biden-Trump debate, with both of those topics among this week’s headlines in review. Still other reports on specific firms and developments in MHVille or affordable housing are provided in this Sunday morning weekly recap. But as the headline clearly states, included today is an array of data on modern manufactured housing compiled and organized in this article that you are unlikely to find in any single report anywhere on earth relevant to U.S. manufactured housing. That may sound bold, but it is regrettably no exaggeration. Too few researchers and reporters, beyond our platforms, pull together the array of information that will be found herein.
For example. When did you see an article this year that clearly stated that the price of new single section (a.k.a.: “single wide” or SW below) manufactured homes has essentially doubled in price between November 2014 ($43,700) and November 2023 ($85,900 – see data in Part III, below), yet pointed out that the price of a new single section manufactured home dropped just over 3 percent in November 2023 ($85,900) compared to November 2022 ($88,000)? Yet those facts are accurate, per data obtained by MHProNews from the U.S. Census Bureau.
Shipments and Production Summary Report 4/01/2024 – 4/30/2024
Shipments
State
SW
MW
Total
Floors
Dest. Pending
13
6
19
25
Alabama
320
271
591
863
Alaska
1
1
2
3
Arizona
50
125
175
300
Arkansas
79
87
166
253
California
43
180
223
413
Colorado
19
25
44
69
Connecticut
8
5
13
18
Delaware
12
29
41
70
District of Columbia
0
0
0
0
Florida
205
460
665
1,131
Georgia
125
278
403
683
Hawaii
0
0
0
0
Idaho
6
28
34
64
Illinois
33
22
55
77
Indiana
78
35
113
148
Iowa
21
14
35
49
Kansas
27
13
40
53
Kentucky
140
192
332
526
Louisiana
301
168
469
638
Maine
36
47
83
130
Maryland
23
7
30
37
Massachusetts
11
6
17
23
Michigan
143
182
325
507
Minnesota
24
25
49
74
Mississippi
199
152
351
503
Missouri
89
61
150
210
Montana
14
22
36
58
Nebraska
13
2
15
17
Nevada
4
28
32
63
New Hampshire
14
17
31
48
New Jersey
12
12
24
36
New Mexico
41
98
139
240
New York
57
76
133
209
North Carolina
236
347
583
932
North Dakota
13
13
26
39
Ohio
106
53
159
212
Oklahoma
113
107
220
327
Oregon
25
64
89
156
Pennsylvania
54
77
131
208
Rhode Island
0
0
0
0
South Carolina
162
257
419
677
South Dakota
8
9
17
26
Tennessee
109
229
338
567
Texas
745
879
1,624
2,512
Utah
8
15
23
38
Vermont
11
7
18
25
Virginia
52
80
132
212
Washington
17
93
110
209
West Virginia
50
70
120
191
Wisconsin
86
27
113
140
Wyoming
10
4
14
18
Canada
0
0
0
0
Puerto Rico
0
0
0
0
Total
3,966
5,005
8,971
14,027
Production
State
SW
MW
Total
Floors
States Shown(*)
255
260
515
778
Alabama
779
830
1,609
2,446
*Alaska
0
0
0
0
Arizona
44
131
175
308
*Arkansas
0
0
0
0
California
35
165
200
374
*Colorado
0
0
0
0
*Connecticut
0
0
0
0
*Delaware
0
0
0
0
*District of Columbia
0
0
0
0
Florida
74
230
304
537
Georgia
181
411
592
1,009
*Hawaii
0
0
0
0
Idaho
29
66
95
166
*Illinois
0
0
0
0
Indiana
472
228
700
928
*Iowa
0
0
0
0
*Kansas
0
0
0
0
*Kentucky
0
0
0
0
*Louisiana
0
0
0
0
*Maine
0
0
0
0
*Maryland
0
0
0
0
*Massachusetts
0
0
0
0
*Michigan
0
0
0
0
Minnesota
43
68
111
178
*Mississippi
0
0
0
0
*Missouri
0
0
0
0
*Montana
0
0
0
0
*Nebraska
0
0
0
0
*Nevada
0
0
0
0
*New Hampshire
0
0
0
0
*New Jersey
0
0
0
0
*New Mexico
0
0
0
0
*New York
0
0
0
0
North Carolina
204
326
530
856
*North Dakota
0
0
0
0
*Ohio
36
58
94
152
*Oklahoma
0
0
0
0
Oregon
35
169
204
382
Pennsylvania
198
260
458
718
*Rhode Island
0
0
0
0
*South Carolina
0
0
0
0
*South Dakota
0
0
0
0
Tennessee
575
791
1,366
2,158
Texas
1,006
1,012
2,018
3,037
*Utah
0
0
0
0
*Vermont
0
0
0
0
*Virginia
0
0
0
0
*Washington
0
0
0
0
*West Virginia
0
0
0
0
*Wisconsin
0
0
0
0
*Wyoming
0
0
0
0
*Canada
0
0
0
0
*Puerto Rico
0
0
0
0
Total
3,966
5,005
8,971
14,027
THE ABOVE STATISTICS ARE PROVIDED AS A MONTHLY
(*) THESE STATES HAVE FEWER THAN THREE PLANTS.
SUBSCRIPTION SERVICE. REPRODUCTION IN PART OR
FIGURES ARE AGGREGATED ON FIRST LINE ABOVE
IN TOTAL MUST CARRY AN ATTRIBUTION TO IBTS, INC.
TOTALS TO PROTECT PROPRIETARY INFORMATION.
Ashok K Goswami, PE, COO, 45207 Research Place, Ashburn, VA
Part II
Cost & Size Comparisons:
New Manufactured Homes and New Single-Family Site-Built Homes
2014 – 2023
2023
2022
2021
2020
2019
2018
2017
2016
2015
2014
New Manufactured Homes
All1
Avg. Sales Price
$ 124,300
$ 127,300
$ 108,100
$ 87,000
$ 81,900
$ 78,500
$ 71,900
$ 70,600
$ 68,000
$ 65,300
Avg. Square Feet
1,435
1,450
1,497
1,471
1,448
1,438
1,426
1,446
1,430
1,438
Avg. Cost per Sq. Ft.
$ 86.62
$ 87.79
$ 72.21
$ 59.14
$ 56.56
$ 54.59
$ 50.42
$ 48.82
$ 47.55
$ 45.41
Single
Avg. Sales Price
$ 84,800
$ 86,400
$ 72,600
$ 57,300
$ 53,200
$ 52,400
$ 48,300
$ 46,700
$ 45,600
$ 45,000
Avg. Square Feet
1,038
1,064
1,084
1,085
1,072
1,072
1,087
1,075
1,092
1,115
Avg. Cost per Sq. Ft.
$ 81.70
$ 81.20
$ 66.97
$ 52.81
$ 49.63
$ 48.88
$ 44.43
$ 43.44
$ 41.76
$ 40.36
Double
Avg. Sales Price
$ 154,100
$ 158,600
$ 132,000
$ 108,500
$ 104,000
$ 99,500
$ 92,800
$ 89,500
$ 86,700
$ 82,000
Avg. Square Feet
1,748
1,757
1,794
1,760
1,747
1,747
1,733
1,746
1,713
1,710
Avg. Cost per Sq. Ft.
$ 88.16
$ 90.27
$ 73.58
$ 61.65
$ 59.53
$ 51.26
$ 53.55
$ 51.26
$ 50.61
$ 47.95
Housing Starts vs. MH Shipments
(Thousands of Units)
New Single Family
Housing Starts
948
1,005
1,127
991
888
876
849
782
715
648
Percent of Total
91%
90%
91%
91%
90%
90%
90%
91%
91%
91%
Manufactured Home Shipments
Shipped
89
113
106
94
95
97
93
81
71
64
Percent of Total
9%
10%
9%
9%
10%
10%
10%
9%
9%
9%
Total
1,037
1,118
1,233
1,085
983
973
942
863
786
712
New Single-Family
Site-Built Homes Sold
(Home and Land Sold as Package)
Avg. Sales Price
$ 514,000
$ 521,500r
$ 458,300r
$ 391,600r
$ 383,900
$ 385,000
$ 384,900
$ 360,900
$352,700
$ 347,700
Derived Average Land Price
$ 104,128
$ 102,298r
$ 97,234r
$ 82,728r
$ 84,485
$ 87,253
$ 91,173
$ 82,491
$ 80,246
$ 84,444
Price of Structure
Avg. Square Feet
2,470
2,503r
2,492r
2,502r
2,518
2,602
2,645
2,650
2,724
2,707
Avg. Price per Sq Ft. (excl. land)
$ 165.94
$ 167.48r
$ 144.89r
$ 123.45r
$ 118.91
$ 114.43
$ 111.05
$ 105.06
$ 100.02
$ 97.25
Manufactured Home Shipments
Total
89,169
112,882
105,772
94,390
94,615
96,555
92,902
81,136
70,544
64,331
Single-Section
40,525
51,022
44,755
42,578
42,930
44,979
46,305
38,944
32,210
30,218
Multi-Section
48,644
61,860
61,017
51,812
51,685
51,576
46,597
42,192
38,334
34,113
New Manufactured Homes Placed
(For Residential Use)
Inside Communities (2021 – )2
55%
59%
51%
X
X
X
X
X
X
X
Land-leased / manufactured home community
29%
36%
31%
X
X
X
X
X
X
X
Private property in subdivision or planned unit development
27%
23%
21%
X
X
X
X
X
X
X
Outside Communities (2021 – )3
45%
41%
49%
X
X
X
X
X
X
X
Other private property
44%
41%
49%
X
X
X
X
X
X
X
Somewhere else
1%
0%
0%
X
X
X
X
X
X
X
Inside Communities (2014 – 2020)
X
X
X
27%
31%
37%
32%
34%
34%
33%
In a park, court, or community
X
X
X
23%
26%
34%
29%
31%
32%
30%
In a subdivision or planned unit development
X
X
X
4%
4%
3%
3%
3%
3%
3%
Private Property (2014 – 2020)
X
X
X
73%
69%
63%
68%
66%
66%
67%
Not in any of the above
X
X
X
73%
69%
63%
68%
66%
66%
67%
Titled as Personal Property
76%
73%
77%
78%
76%
77%
76%
77%
80%
80%
Titled as Real Estate
20%
21%
19%
19%
19%
17%
17%
17%
14%
13%
r Revised – refers to seasonal index and seasonally adjusted annual rate figures
1 Includes manufactured homes with more than two sections.
2 Subcategories for this item were revised with the implementation of a new questionnaire in January 2021. This category now contains units located on private property within communities. Prior to 2021, all units on private property were assumed to be located outside communities. Percentages are calculated based on the estimates shown in each category in https://www2.census.gov/programs-surveys/mhs/tables/time-series/Annual_Char.xlsx
3 Subcategories for this item were revised with the implementation of a new questionnaire in January 2021. This category now contains only units located on private property that are outside communities in addition to units outside communities not located on private property. Percentages are calculated based on the estimates shown in each category in https://www2.census.gov/programs-surveys/mhs/tables/time-series/Annual_Char.xlsx
Note: The Census Bureau has reviewed this data product for unauthorized disclosure of confidential information and has approved
the disclosure avoidance practices applied. (Approval ID: CBDRB-FY24-0318)
Source: U.S. Census Bureau and U.S. Department of Housing and Urban Development, Survey of Construction, https://www.census.gov/construction/chars/; https://www.census.gov/construction/nrc/xls/starts_cust.xls.
Source: U.S. Census Bureau and U.S. Department of Housing and Urban Development, Manufactured Housing Survey.
Part III
Average Sales Price of New Manufactured Homes by Region and Size of Home
By Month of Shipment
(Dollars)
United States
Northeast
Midwest
South
West
Total1
Single
Double
Total1
Single
Double
Total1
Single
Double
Total1
Single
Double
Total1
Single
Double
2023
November
126,600
85,900
154,100
122,600
92,400
158,200
116,800
83,900
157,300
125,100
85,200
150,000
149,600
90,600
175,900
October
120,000
83,300
147,700
118,900
84,300
151,900
111,400
84,600
149,400
119,900
83,000
147,400
135,100
82,200
146,100
September
119,700
80,400
151,700
128,700
85,400
172,800
116,000
83,500
159,400
115,900
78,000
144,500
142,300
87,600
178,400
August
128,800
89,800
154,600
132,500
105,200
158,400
113,900
92,200
145,900
128,500
86,500
153,800
149,500
94,400
163,300
July
118,000
82,300
150,200
122,700
72,900
143,100
116,000
81,400
153,400
114,900
82,600
149,300
137,000
84,800
154,900
June
121,400
85,400
153,900
121,800
85,300
149,800
111,800
84,200
153,700
120,100
85,300
152,600
140,000
89,500
162,400
May
129,900
86,300
160,200
120,900
89,800
146,000
104,900
82,900
141,000
132,500
87,800
161,600
149,700
79,800
171,800
April
125,000
86,100
153,600
123,900
87,000
160,800
112,300
87,000
148,900
123,200
83,200
150,100
150,600
105,100
173,400
March
124,700
85,200
155,400
135,200
100,600
172,900
109,400
88,600
152,000
123,800
80,800
153,100
140,800
94,900
162,000
February
128,100
89,200
160,400
136,600
107,000
167,800
114,400
85,300
158,800
127,800
88,200
157,900
144,000
92,800
170,000
January
126,100
82,100
156,900
122,900
86,700
148,300
107,200
83,600
153,100
129,200
81,200
158,300
131,500
81,300
156,700
2022
December
122,100
80,200
155,700
113,900
75,300
158,300
104,700
82,300
144,300
124,000
80,700
155,400
134,700
77,600
162,400
November
125,200
88,000
155,200
119,200
93,900
146,700
113,600
89,100
147,600
126,000
86,500
155,800
138,400
89,500
161,800
October
128,300
81,400
160,400
127,000
86,400
155,300
113,500
87,500
156,700
128,100
77,000
160,000
153,600
86,200
167,300
September
130,400
95,800
159,400
131,300
101,400
162,000
114,600
93,000
155,500
130,300
94,400
158,500
148,600
107,500
163,900
August
125,700
86,500
158,800
117,800
74,700
145,100
110,900
87,500
151,900
126,400
86,000
159,400
144,100
93,400
166,400
July
131,800
85,200
161,600
129,700
93,300
157,400
110,800
83,600
156,100
131,300
82,900
158,700
156,800
97,300
178,200
June
126,900
87,600
159,600
118,500
92,700
134,100
112,500
90,100
146,500
125,300
88,200
159,900
154,200
68,400
174,500
May
124,900
85,800
159,200
121,500
82,100
148,500
112,300
83,600
148,800
124,400
85,900
162,400
142,000
91,900
156,100
April
132,000
83,100
168,000
128,900
87,200
154,700
110,400
80,500
147,800
132,100
83,500
169,900
155,400
82,400
176,600
March
129,200
87,300
156,600
117,900
97,400
145,300
118,500
90,000
154,200
127,400
85,200
154,400
156,100
89,800
171,600
February
128,000
87,700
156,300
130,600
76,000
152,700
115,900
82,400
155,500
126,300
89,500
155,000
150,100
85,100
163,600
January
122,500
84,600
152,800
120,600
85,900
141,800
108,300
82,800
145,400
122,700
85,400
153,300
140,800
80,700
161,000
2021
December
123,200
80,900
150,300
104,700
73,900
127,200
103,300
88,200
129,400
123,500
80,000
149,600
145,200
76,900
170,600
November
111,900
76,400
139,900
100,900
71,600
133,500
107,300
78,100
143,800
110,700
77,000
138,400
128,800
68,400
145,500
October
112,000
81,700
138,200
110,300
74,400
138,700
101,000
81,000
132,600
110,700
81,900
136,400
131,600
85,000
150,400
September
118,300
78,800
141,300
102,100
76,100
124,100
109,300
80,900
142,300
119,300
78,500
142,200
132,100
76,200
141,600
August
112,000
80,000
138,000
105,000
86,000
117,000
100,000
77,000
132,000
112,000
80,000
139,000
135,000
79,000
143,000
July
118,700
76,000
137,800
98,500
74,100
125,700
110,500
79,100
139,300
119,200
74,500
137,100
131,100
81,700
142,800
June
106,800
70,200
128,100
101,600
73,700
124,200
94,900
65,600
125,800
107,500
70,700
128,000
116,400
72,200
131,500
May
106,500
69,900
128,300
98,400
69,900
121,500
94,300
67,500
128,200
109,900
70,600
129,200
104,400
70,300
125,500
April
100,200
66,700
122,500
95,900
73,800
113,300
85,400
61,800
125,400
100,400
67,700
122,200
118,400
65,000
125,000
March
98,100
63,300
123,200
91,400
58,600
121,300
86,400
60,800
119,100
98,100
63,700
122,400
113,000
67,300
130,800
February
98,300
65,400
122,500
88,300
59,400
113,800
87,300
62,400
118,100
98,100
67,100
121,800
116,900
60,900
131,900
January
95,000
64,100
118,500
102,600
67,900
116,200
83,000
62,100
112,700
94,000
64,600
117,300
113,400
62,300
129,500
2020
December
90,200
62,600
110,800
93,600
58,200
115,300
77,100
55,800
107,900
90,100
64,500
109,900
108,800
64,500
115,900
November
92,600
63,500
112,800
85,600
63,600
103,900
81,000
62,400
117,400
92,600
64,200
109,700
115,400
60,100
128,200
October
89,400
57,200
110,000
91,000
57,700
112,100
81,700
58,300
108,000
87,400
56,500
107,900
108,900
61,200
120,000
September
87,300
58,300
107,800
84,800
61,000
105,600
72,100
52,800
98,300
86,900
58,400
105,700
110,100
68,600
126,600
August
88,200
57,700
109,300
87,600
56,700
109,600
75,900
59,500
97,600
87,900
56,800
109,100
104,900
60,500
119,500
July
84,200
59,800
102,700
78,600
58,600
100,300
72,600
56,900
97,000
83,700
59,500
101,300
103,700
72,100
113,200
June
85,600
52,900
109,800
91,700
55,400
117,000
81,400
56,100
115,200
82,700
51,700
106,800
102,700
55,600
117,000
May
85,900
55,200
109,100
79,100
56,300
100,200
73,400
56,800
100,900
85,200
54,100
108,500
105,100
60,700
117,800
April
86,900
53,300
108,200
86,100
53,900
105,200
79,500
57,000
105,000
84,000
51,600
106,100
111,800
64,500
120,300
March
82,900
53,800
106,900
79,100
54,400
102,400
79,200
55,300
108,400
82,000
53,300
106,900
92,600
54,300
106,700
February
83,400
55,600
107,500
81,500
54,000
109,800
70,900
55,200
98,200
82,000
55,300
105,600
103,500
59,600
118,900
January
86,400
55,300
107,900
77,700
52,900
104,800
74,200
55,400
101,800
86,200
55,200
108,100
103,400
59,900
111,300
2019
December
86,400
54,400
105,700
79,500
54,000
98,500
70,200
54,400
96,100
87,900
54,600
106,900
97,700
52,100
107,600
November
81,600
52,100
107,100
79,200
49,400
113,100
73,400
50,600
104,000
79,500
52,500
104,800
101,400
54,100
114,700
October
81,700
53,900
103,800
80,600
61,200
101,600
72,100
53,800
100,200
81,600
52,500
103,400
96,600
58,800
109,100
September
81,500
55,600
101,800
84,100
59,600
103,700
71,900
55,900
98,400
80,200
55,100
99,300
99,500
55,300
113,000
August
84,100
49,200
107,900
81,900
45,700
101,200
75,700
52,500
99,800
81,400
48,700
106,600
107,500
48,200
120,700
July
82,000
54,000
106,500
88,000
51,600
129,500
74,400
53,900
105,700
78,100
54,900
100,300
108,400
45,700
121,000
June
84,400
52,800
103,800
84,800
57,800
109,100
72,600
52,700
97,100
83,400
53,200
100,500
100,600
47,000
118,800
May
78,100
53,800
98,100
76,400
49,200
105,200
72,300
56,000
98,100
75,800
53,600
95,000
96,300
55,000
106,800
April
78,900
55,700
100,700
82,000
59,300
109,000
70,800
56,700
91,900
77,100
54,000
99,300
95,400
63,600
109,100
March
78,900
50,400
102,100
74,500
48,000
98,400
71,300
49,900
96,300
77,800
50,900
101,600
92,900
49,100
108,500
February
85,000
52,600
107,600
74,100
52,300
97,500
72,500
56,000
97,200
84,800
52,600
106,600
103,100
43,500
119,400
January
81,800
53,400
103,400
86,600
60,100
109,000
68,000
54,200
98,000
81,100
51,400
101,700
95,800
59,000
110,400
2018
December
82,400
52,100
106,000
79,600
57,500
93,600
74,300
53,800
96,400
80,100
51,500
104,900
101,400
51,600
120,400
November
79,900
55,400
100,500
81,400
52,300
104,700
74,100
56,200
101,900
77,100
54,600
97,800
99,300
62,600
107,800
October
82,400
54,500
106,000
81,600
59,300
96,200
73,100
56,700
94,300
79,800
53,500
105,900
105,100
57,300
116,500
September
83,600
54,400
105,400
78,800
57,600
97,300
76,700
58,300
105,500
81,600
51,900
104,500
102,600
62,000
111,600
August
81,500
55,100
100,900
82,900
58,400
113,000
73,600
54,500
97,800
79,800
54,500
98,100
97,400
57,600
110,300
July
78,900
52,000
99,300
73,600
33,900
100,600
79,600
57,300
104,500
74,900
51,300
94,000
102,800
59,300
118,200
June
85,400
54,900
101,300
82,400
52,900
97,500
77,400
52,700
99,700
83,200
55,100
97,100
105,000
57,600
122,900
May
81,200
57,100
99,100
81,700
62,400
104,300
72,500
57,600
92,900
79,000
56,300
97,000
104,000
60,300
108,900
April
74,900
50,600
98,700
87,300
54,900
109,900
67,300
51,600
92,800
71,100
48,600
95,300
103,100
67,400
113,400
March
70,600
49,800
91,400
70,900
50,400
96,600
67,700
50,600
93,800
68,900
50,000
88,900
82,900
45,800
98,700
February
73,400
47,900
93,800
80,400
50,800
98,200
72,100
49,700
98,000
70,600
46,700
91,200
87,100
53,900
100,600
January
69,000
47,300
92,100
79,500
52,400
106,000
59,300
44,900
85,600
64,400
46,300
85,900
98,900
59,400
114,200
2017
December
72,900
53,400
91,800
76,900
49,200
100,300
64,900
48,700
84,500
70,000
54,000
89,000
96,400
58,600
103,900
November
71,800
46,600
99,100
75,300
49,400
107,000
68,100
48,500
90,500
65,800
45,900
91,600
114,500
49,800
130,300
October
68,300
46,400
95,500
76,300
45,100
96,900
65,600
48,600
88,600
64,200
45,700
93,600
95,200
50,900
106,900
September
71,800
47,100
93,800
72,400
50,800
92,700
62,800
45,500
87,200
68,800
46,600
89,000
95,600
51,700
116,700
August
73,800
47,600
94,300
70,400
50,400
88,700
65,300
48,200
88,600
72,500
47,200
91,500
91,600
46,600
110,900
July
75,300
47,900
93,800
80,700
52,500
102,100
70,900
48,200
89,400
70,300
47,900
88,400
99,700
44,500
111,900
June
75,600
49,500
97,400
84,800
57,300
95,500
69,400
49,900
94,300
70,800
49,300
91,600
106,300
46,600
125,000
May
71,800
49,100
87,900
78,800
55,500
93,300
64,600
45,200
84,400
68,500
49,400
84,000
94,900
47,800
104,500
April
73,300
47,400
89,900
79,600
53,800
100,200
63,900
47,800
84,500
70,900
45,500
86,600
93,000
57,200
104,300
March
70,100
50,800
88,000
76,900
56,700
100,700
64,500
49,600
83,900
67,000
50,700
84,600
89,800
49,400
99,400
February
71,000
48,700
92,500
86,500
48,700
96,300
61,500
46,800
84,700
66,200
48,400
87,300
104,200
59,000
115,100
January
68,100
44,900
89,700
84,700
59,900
99,600
59,800
45,800
85,100
64,600
44,000
85,900
93,600
45,800
107,100
2016
December
73,100
49,900
90,800
73,900
44,200
92,800
67,100
45,000
85,800
71,400
50,100
89,000
85,900
56,000
101,500
November
71,700
47,000
90,900
70,800
45,500
94,000
58,900
46,500
84,700
72,100
47,100
88,000
89,200
48,100
108,900
October
71,600
48,300
87,400
75,300
45,700
90,700
60,200
47,600
81,300
71,300
47,500
84,700
85,100
54,100
104,000
September
69,400
46,700
93,000
79,600
55,400
101,800
62,400
46,100
96,500
65,300
45,400
89,300
93,900
58,000
99,000
August
74,200
50,000
93,100
86,100
57,500
106,600
60,800
45,500
84,300
71,600
46,100
91,300
95,000
79,900
99,600
July
73,300
49,500
91,000
73,900
53,400
103,600
65,900
48,200
91,700
70,200
47,700
87,100
96,800
67,700
100,600
June
70,500
46,600
87,000
85,000
50,900
113,700
61,500
45,100
84,100
66,800
44,900
81,500
89,000
57,100
100,300
May
71,300
45,800
87,800
75,900
45,900
99,600
63,500
46,700
86,600
69,800
45,000
84,600
83,500
48,000
96,400
April
67,800
44,100
87,500
78,600
45,400
100,100
61,600
45,900
86,900
64,900
42,500
85,000
85,400
53,900
92,900
March
69,800
44,500
88,300
72,800
45,100
103,200
59,200
46,200
83,200
69,600
44,100
86,300
83,200
42,500
97,000
February
67,600
43,900
92,600
81,500
50,000
97,300
57,900
45,600
85,100
65,300
43,000
89,700
84,800
45,400
106,600
January
67,600
45,900
84,100
69,400
48,100
90,700
61,400
48,200
86,800
65,200
44,600
80,200
86,900
50,000
96,100
2015
December
70,800
46,200
88,100
74,200
52,100
95,300
63,300
46,600
85,900
69,200
45,700
85,500
84,400
44,600
96,400
November
68,000
44,300
89,400
79,000
52,500
90,600
61,100
47,300
84,500
63,200
42,500
84,000
96,100
51,000
110,300
October
66,800
43,800
84,900
77,100
45,100
95,200
56,500
43,100
79,700
65,500
43,200
82,200
78,900
47,300
95,400
September
70,700
48,400
87,700
71,600
54,400
91,400
63,900
50,600
83,900
68,500
46,800
85,500
90,100
49,700
97,900
August
67,000
42,900
87,100
73,300
53,600
94,100
61,600
45,700
90,000
62,800
39,400
80,700
89,200
48,200
106,400
July
64,500
44,400
83,700
68,000
47,700
83,100
62,600
48,500
84,600
59,800
42,900
78,400
88,200
46,800
101,000
June
69,100
45,500
87,500
68,100
53,200
90,700
60,500
45,900
84,200
66,100
44,000
83,700
93,700
46,700
102,800
May
69,500
47,300
89,100
69,500
46,100
84,700
61,800
43,000
92,600
68,100
49,000
85,600
83,400
44,200
100,700
April
67,400
46,900
86,500
69,400
48,900
88,800
59,700
47,900
75,000
64,700
46,800
82,200
89,600
45,100
111,100
March
66,200
46,100
85,000
89,000
52,300
114,000
60,900
47,400
86,400
63,200
44,100
80,300
79,300
53,600
96,600
February
68,300
46,200
87,000
66,500
50,000
88,800
59,600
47,500
80,600
65,900
45,600
84,200
90,200
45,500
99,600
January
68,400
44,600
84,400
64,700
45,600
77,200
57,000
43,700
78,300
64,600
44,900
79,400
102,500
42,600
107,700
2014
December
64,800
46,200
78,100
68,100
55,300
77,500
57,000
45,600
72,900
62,000
45,500
75,000
86,900
52,600
91,800
November
64,200
43,700
83,500
80,500
58,000
98,300
61,600
47,600
84,700
59,100
39,900
78,300
84,800
57,400
95,100
October
62,400
46,000
76,900
63,400
50,900
73,600
64,500
50,900
78,700
59,000
44,400
74,700
77,100
47,100
84,700
September
67,000
43,600
82,600
71,900
45,000
88,500
59,000
41,600
78,500
66,000
44,500
80,900
80,200
39,900
90,100
August
67,100
44,200
87,600
71,700
43,100
93,600
60,200
46,800
80,900
66,400
43,300
87,800
75,400
45,800
88,900
July
63,500
45,400
80,100
57,900
43,900
73,300
61,600
45,200
77,800
61,200
45,700
77,800
79,300
45,200
92,900
June
65,200
44,900
84,000
73,800
47,000
94,900
58,700
45,600
81,200
62,600
44,600
81,000
82,300
44,200
92,300
May
65,400
45,700
78,300
62,900
50,200
76,200
61,700
46,800
79,600
64,000
44,200
76,100
77,400
49,000
88,900
April
66,400
44,700
83,000
61,300
44,000
82,500
59,100
45,700
78,500
66,100
43,900
81,300
77,100
47,600
92,900
March
65,700
43,200
83,900
76,400
43,100
91,600
58,100
45,100
81,800
63,600
42,400
82,100
84,400
46,700
90,300
February
64,300
45,000
82,200
59,100
40,600
76,200
59,700
44,800
86,100
62,200
44,800
79,700
79,600
48,800
90,800
January
68,300
48,000
84,500
72,100
48,700
92,600
72,000
51,400
88,200
63,800
46,900
80,700
87,700
55,400
93,900
1 Includes manufactured homes with more than two sections.
Note: Estimates include manufactured homes that are sold and those intended for sale for residential use.
Note: The Census Bureau has reviewed this data product for unauthorized disclosure of confidential information and has approved
the disclosure avoidance practices applied. (Approval ID: CBDRB-FY23-0317)
Source: These data are produced by the U.S. Commerce Department’s Census Bureau from a survey sponsored by the
U.S. Department of Housing and Urban Development.
Part IV – Based on Federal Data, Implications of Total U.S. Manufactured Housing Production Data by Year Since 1998 to 2023
MHVille
U.S. Production
Year
Production
1998
373,143
1999
348,075
2000
250,366
2001
193,120
2002
165,489
2003
130,815
2004
130,748
2005
146,881
2006
117,373
2007
95,752
2008
81,457
2009
49,683
2010
50,056
2011
51,618
2012
54,881
2013
60,228
2014
64,334
2015
70,544
2016
81,136
2017
92,902
2018
96,555
2019
94,615
2020
94,390
2021
105,772
2022
112,882
2023
89,169
3,201,984
If 1998 production level of 373,143 had continued for each of the 26 years that total of production could have been = 9,701,718
Take that 9,701,718 potential (at constant 1998 level) – 3,201,984 actual production = 6,499,734 difference.
That 9.7 million homes that could have been produced in 26 years given the 1998 pace having hypothetically held annually – vs. the 3.2 million homes that were actually produced reveals a total deficit or difference of about 6.5 million
Part V – Additional Information with More MHProNews Analysis and Commentary
In no particular order of importance are the following insights and observations.
1) For a few years, MHProNews spotlighted a Manufactured Housing Institute (MHI) generated “industry overview” or “quick facts” that they seemed to suspend from public access. When it was pointed out by MHProNews that MHI had suspended sharing that document publicly, they once more made it available publicly. However, a key item from that document was tweaked by MHI before it was published.
The image above was from a prior fact check of the MHI website. The image was uploaded to MHProNews on November 28, 2023. Note: depending on your browser or device, many images in this report can be clicked to expand. For example, in some browsers/devices you click the image and select ‘open in a new window.’ After clicking that selection, you click the image in the open window to expand the image to a larger size. To return to this page, use your back key, escape or follow the prompts. MHProNews uploaded the image above on November 28, 2023. Note: depending on your browser or device, many images in this report can be clicked to expand. For example, in some browsers/devices you click the image and select ‘open in a new window.’ After clicking that selection, you click the image in the open window to expand the image to a larger size. To return to this page, use your back key, escape or follow the prompts.
2) But on this same date, now MHI has once more made an item they call their “Industry Overview” publicly available instead of “members only.” However, it is different than their prior versions of “Quick Facts” or “Industry Overview.” There is a plant map which shows where manufactured home production centers are found. There are statements made about manufactured housing, but the visuals and factoids previously provided are missing.
This isn’t earth shattering, but it does reflect several points that MHProNews has been reporting for some time. Among them is that MHI can and does make decisions to vanish in an arguably Orwellian fashion information that for their own reasons they decide at that time do not fit their narrative or agenda. For instance, the percentage of new manufactured homes going into communities is no longer provided in the 2024 Industry Overview, which are posts on this date and not a download.
49% of new manufactured homes are placed on private property and 51% are placed in manufactured home communities
From the MHI 2023 version (June 2023) is this statement.
31% of new manufactured homes were placed in manufactured home/land-lease communities in 2021.
At least on this date (6.27.2024), there is no apparent download from MHI on this placement topic, and their posts do not appear to provide this data. But note that MHI in 2023 provided 2021 data, previously provided in 2021 only reworded?
Now, compare what MHI said above to what the U.S. Census Bureau provided to MHProNews (this is some of the same info as provided in Part II above, but placed in closer proximity to what the reader is comparing it to for reader ease. The bold is added by MHProNews.
3)
a) Based on Part V #2 above which links the referred to MHI “Quick Facts” or “Industry Overview” by year, it would appear that MHI’s 2020 report is referring to 2018 information provided by the Census Bureau. Not 2019, not 2020, but 2018. If someone scrolls further into that year’s document, that is clarified on a different page, but there is no clarification on the page where the data quoted above is first presented by MHI.
b) Similarly, the MHI 2021 data appears to be based upon the Census Bureau’s 2019 report. Once more, that is not clear from the first usage, but is clarified for someone that might be detail minded pages later in their document.
c) In the 2022, it is 2021 data that MHI is used, not 2020. But that year, the Census Bureau began providing additional information that clarified that in 2021 “Insider Communities” actually meant more than just “land lease,” because just below the data shown reflects that only 31 percent of those placements went into a land-lease manufactured home community, such as their members like: Equity LifeStyle Properties, Sun Communities, UMH Properties, Flagship Communities, Legacy Communities, etc. might be purchasing for resale or rental purposes. Whether this was incidentally misleading or deliberate on the part of MHI is an open question. At a minimum, it was arguably sloppy on the part of MHI, because a reader would have to intuit from one remark pages apart how it relates to something pages later.
d) It isn’t until MHI’s June 2023 update that they state that the information provided is from 2021. Note that prior versions of this particular fact-checked item should be reconciled with this article’s new revelation.
New Manufactured Homes Placed
2023
2022
2021
2020
2019
2018
2017
2016
2015
2014
(For Residential Use)
Inside Communities (2021 – )2
55%
59%
51%
X
X
X
X
X
X
X
Land-leased / manufactured home community
29%
36%
31%
X
X
X
X
X
X
X
Private property in subdivision or planned unit development
27%
23%
21%
X
X
X
X
X
X
X
Outside Communities (2021 – )3
45%
41%
49%
X
X
X
X
X
X
X
Other private property
44%
41%
49%
X
X
X
X
X
X
X
Somewhere else
1%
0%
0%
X
X
X
X
X
X
X
Inside Communities (2014 – 2020)
X
X
X
27%
31%
37%
32%
34%
34%
33%
In a park, court, or community
X
X
X
23%
26%
34%
29%
31%
32%
30%
In a subdivision or planned unit development
X
X
X
4%
4%
3%
3%
3%
3%
3%
Private Property (2014 – 2020)
X
X
X
73%
69%
63%
68%
66%
66%
67%
Not in any of the above
X
X
X
73%
69%
63%
68%
66%
66%
67%
Titled as Personal Property
76%
73%
77%
78%
76%
77%
76%
77%
80%
80%
Titled as Real Estate
20%
21%
19%
19%
19%
17%
17%
17%
14%
13%
See bullets 2, 3, and 4 in the second box, above.
4) One of the effects of the problematically stated use of MHI’s information is that it served to suggest that in August 2022 report that placements in land leases significantly were higher than they actually were. As the Census Bureau explained: 31 percent went into a land lease, while some 21 percent went into “Private property in subdivision or planned unit development.” The other 49 percent went onto private property outside of a land-lease or private-property subdivision style community, per the Census Bureau.
Yes, shipments going into land-leases from 2022 compared to 2023 declined. But the mix going into land-lease from producers by year, per the Census Bureau, is as shown below.
2023
2022
2021
Land-leased / manufactured home community
29%
36%
31%
See reports from MHI members Cavco and Skyline Champion for specifics on their remarks about delays and reductions of shipments going into land-lease communities.
6) The National Association of Realtors and Fannie Mae recently released new housing data previously reported that indicate that higher housing and lending costs are among the factors depressing the new and resale housing markets.
Over the first four months of 2024, the total number of single-family permits issued year to date (YTD) nationwide reached 336,124. This is an increase of 25.3% on a year-over-year basis over the April 2023 level of 268,205.https://t.co/vZ8rmdIofD
Note that the tweet (X-post) below reflects that the NAHB doesn’t mind making a reference to the NAR. Which begs the question, why does MHI seem to pretend that there is no MHARR, which has existed since 1985? Especially since MHI and MHARR have previously collaborated in getting legislation useful to the industry enacted?
Existing home sales fell for the third straight month in May because of lingering high mortgage rates and record-high prices, according to the National Association of Realtors (NAR).https://t.co/gdsyRln7Ed
According to the The State of the Nation’s Housing 2024 report from @Harvard_JCHS, rents and home prices have increased 26% and 47%, respectively, since 2020, primarily affected by a lack of housing inventory. https://t.co/OAXMnIf0zu | #realestate#housing
7) Facts and evidence like the above build upon the insights from the Andy Gedo redux, explored in the report linked below, which was part of our coverage of the Innovative Housing Showcase.
8) Far more costly conventional housing has witnessed a YoY increase in building permits of 25.3% in the first four months of 2024, per the NAHB. Earlier this month, MHARR said that the latest official “statistics indicate that HUD Code manufacturers produced 8,971 new homes in April 2024, a 34.37% increase over the 6,676 new HUD Code homes produced in April 2023. Cumulative production for 2024 now totals 33,248 homes, a 19.3% increase over the 27,850 HUD Code homes produced over the same period in 2023.” Meaning, while manufactured housing production has increased – as have single family building permits – the rate of increase for less costly manufactured homes is lower than the rate of increase for more costly conventional housing.
10) To better understand why manufactured housing is struggling when favorable federal laws exist yet are not being properly or consistently enforced, a view that both MHI on paper seemingly agrees with MHARR on, the reports for the week in review provide more detailed facts and insights.
Don’t miss today’s postscript.
With no further adieu, here are the headlines for the week in review from 6.23 to 6.30.2024.
Postscript (Part VII)
1) Since our report on Friday 6.28.2024, Joe and Jill Biden have both made it plain that they intend to stay in the 2024 race, despite a performance that has been panned even by numbers of influential Democrats (see report linked here and above). Former President Barack Obama has per reports attempted to reassure the Democratic donor class that Biden can successfully stay the course.
2) That noted, several post-debate polls reflect the common view that Biden lost and Trump won the debate.
Per the left-leaning The Hill, which cited left-leaning CNN’s poll: “More than two-thirds of viewers of Thursday’s debate between President Biden and former President Trump said the Republican won…
The Daily Mail’s flash poll said:
Some 68 percent said Donald Trump came out on top of the clash
Some 62 percent said he [i.e.: Joe Biden] should be dumped from the [Democratic] ticket.
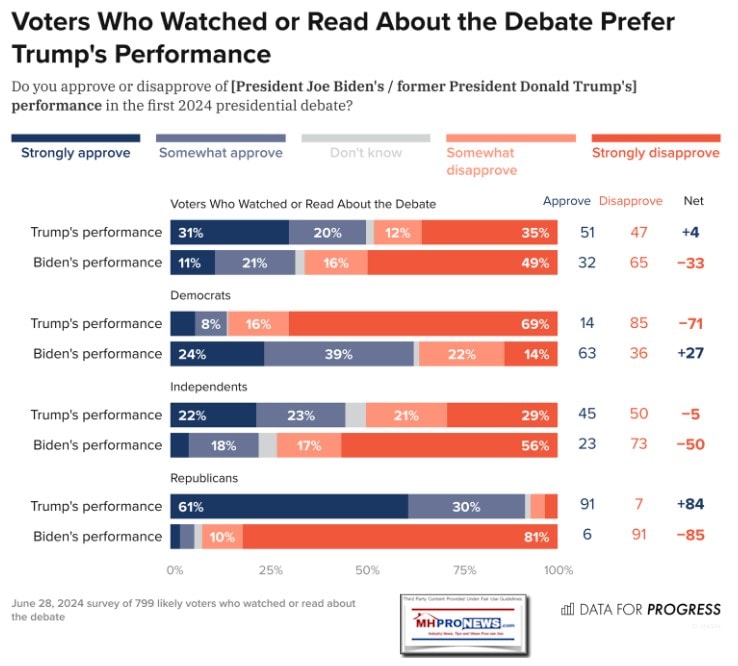
Data for Progress reported about their post-debate poll the following.
When asked who won the debate, among voters who watched the debate or read about it, 30% say that Biden won, while 62% say that Trump won.
Note: in several devices, the images below can be opened to a larger size. You can typically click the image and follow the prompts to enlarge.
Note: depending on your browser or device, many images in this report and others on MHProNews can be clicked to expand. Click the image and follow the prompts. For example, in some browsers/devices you click the image and select ‘open in a new window.’ After clicking that selection you click the image in the open window to expand the image to a larger size. To return to this page, use your back key, escape or follow the prompts. Note: depending on your browser or device, many images in this report and others on MHProNews can be clicked to expand. Click the image and follow the prompts. For example, in some browsers/devices you click the image and select ‘open in a new window.’ After clicking that selection you click the image in the open window to expand the image to a larger size. To return to this page, use your back key, escape or follow the prompts. Note: depending on your browser or device, many images in this report and others on MHProNews can be clicked to expand. Click the image and follow the prompts. For example, in some browsers/devices you click the image and select ‘open in a new window.’ After clicking that selection you click the image in the open window to expand the image to a larger size. To return to this page, use your back key, escape or follow the prompts.
A clear majority of debate-viewing voters (57%) say Trump performed best on Thursday, including 19% of Democrats, 60% of independents and 93% of Republicans.
…our post-debate survey shows President Joe Biden has lost no immediate ground to Trump, most voters, including a 47% plurality of Democrats, say Biden should be replaced as the Democratic candidate for president.
The Biden campaign viewed last night’s debate as another opportunity to assuage concerns about his age and mental acuity, but that didn’t work: Among debate viewers, 78% say Biden is too old, compared with 64% of all voters who said the same days before the debate.
3 in 10 Democrats say Harris should be the party’s nominee if Biden drops bid
4) Left-leaning CNN called Biden’s performance “disastrous.” “Biden’s disastrous debate pitches his reelection bid into crisis,” said CNN: “If Joe Biden loses November’s election, history will record that it took just 10 minutes to destroy a presidency.”
The IPSOS poll said in a post-debate flash poll that: “A majority of likely voters who watched the first 2024 Presidential debate felt that Republican candidate Donald Trump performed the best, according to a two-wave 538/Ipsos poll of likely voters conducted in the days leading up to and immediately after the debate.”
Also per IPSOS:
Ratings of Biden’s mental and physical fitness to be president declined following the debate.
Before the debate, 27% of likely voters rated Biden as good or excellent when it came to his mental fitness to be president. Following the debate, that level declined to 20%. The decline was steepest among Democratic respondents, going from 56% before the debate to 42% after the debate.
These levels also saw sharp declines among Black respondents (-15 percentage points), those aged 65+ (-11), and those with a Bachelor’s degree or higher (-10).
Ratings of Trump’s mental (39% pre-debate, 41% post-debate) and physical (43%, 45%) fitness were stable. …”
5) But there was much more at stake in the debate than merely who won or lost the discussion that night between deposed President Donald J. Trump and current White House Resident Joe Biden. But first, let’s note that left-leaning CBS News reported that: “The much-anticipated debate on Thursday night between President Joe Biden and former President Donald Trump drew an estimated 51.27 million viewers to the CNN presentation, Nielsen and CNN reported on Friday.” Reuters said: “The number is about 30% lower than the 73 million people who watched the candidates’ first face-off in 2020, and among the three lowest-rated first presidential debates since 1976.” That may be fortunate for Biden, as pre-debate some were speculating that it could be the most watched debate ever.
What could prove to be more important than winning or losing the first debate? There is evidence that several are wondering aloud how Democratic leaders, the White House, and elements (not all) of the mainstream media could have covered up Biden’s condition from the public for so long. Those who watch, listen to or read more conservative media would not have been surprised by what they saw from Biden, nor by what they saw in Trump. But for years, much of the left-leaning media, various Democratic leaders and public officials have effectively covered up Biden’s condition. While it is to soon to say with certainty, that may prove to be problematic for the left. Why? Because thinking people may wonder, if they misled us about Biden’s condition, what else did they misled us about? Note – don’t miss #8 below from a former high-ranking Democrat.
6) To illustrate that point (#5 above about more important than winning or losing debate), consider what Brendan O’Neill, Chief Political Writer for Spiked had to say (note: this was featured by Real Clear Politics).
Why the Democrats lied about Joe Biden’s frailty
The presidential debate has exposed the ruthlessness of the American establishment.
So this is how republics die. Not with a bang but with the hoarse ramblings of their ageing leaders. Few events have shone a light on ‘American decline’ as much as Joe Biden’s sad, impassive performance in last night’s CNN presidential debate. Here was the leader of the free world speaking in faint, broken tones, and struggling to stay focussed, and at points seeming to blank out entirely. Before the eyes of the world, it became clear: this man is too old, too frail and too infirm to be at the helm of America.
And yet, Old Joe’s physical infirmity is not the thing that should horrify us. Everyone ages, everyone withers. No, it is the moral infirmity of the Democratic establishment that is truly chilling. It is those who are so bent on power that they’ll force a frail man on to the world stage to do their bidding who deserve our ire. It is the media movers and shakers who said ‘Joe is fine’, and who damned the concerned as ageist cranks, who have behaved atrociously. Behind Biden’s physical decay is the far graver problem of the moral decay of a ruling class that will lie, gaslight and bully just to stay on top.”
Ouch. Tell us how you really feel about this O’Neill. Note, typo’s in these quoted segments are in the original.
…At times, Biden glitched completely. Fourteen minutes into proceedings, and then again 22 minutes into proceedings, his mental faculties seemed to betray him and he just stalled. The moderator, Jake Tapper, had to save him at one point, delivering a merciful ‘Thank you, Mr President’ after he malfunctioned during a muddled commentary on Covid or Medicare or something.”
…He was a shadow of his old self, and you found yourself wondering if he’d make it to the end of the debate, never mind through another four years of steering the free world.
It was so bad that even the liberal media, like groundhogs finally stirring from hibernation, piped up and said: ‘Is there something wrong here?’ The kind of people who said ‘Joe is fine’ as he stuttered and stumbled through speeches and meetings are now wondering if actually Joe might be knackered. Overnight, the New York Times has been gripped by dread over Biden’s health. ‘Biden cannot go on like this’, says one headline. ‘He must bow out of the race’, says another. This is the same New York Times which just last year was thundering against ‘the manufactured panic over Biden’s age’. When us plebs raise concerns about Biden’s wellbeing, it’s fabricated crap. When the Old Grey Lady [MHProNews note: Grey Lady a.k.a. New York Times] does it, it’s legit.”
The panic now sweeping through Democratic circles feels enraging. You want to shout: ‘Where have you people been?’ ‘Democrats panic as Biden stumbles in bad-tempered debate with Trump’, says the Financial Times (‘stumbles’ – still with the euphemisms). Dem bigwig Van Jones says Biden ‘didn’t do well at all’ and should now consider ‘taking a different course’. Seeing him so scrambled was ‘personally painful’, said Jones. According to reports, party strategists are discussing the possibility of replacing Biden ahead of the election. That noise you can hear is the scales falling from a thousand eyes.
These overnight worriers for Biden’s wellbeing are utterly without shame. For all of them belong to that credentialled class that has either been content to ignore the blazing signs of Biden’s waning health or have actively conspired in playing it down. For years these people gaslit the American populace. Biden’s in tip-top shape, they said, as if millions of Americans haven’t nursed old relatives through the twilight years and seen with their own eyes what age can do. Just three months ago, CNN’s own one-time White House correspondent, John Harwood, damned the talk of Biden’s ‘alleged mental decline’ as ‘utter bullshit’. Now CNN platforms a presidential debate in which that mental decline becomes abundantly, terribly clear.”
O’Neill then lashed the insiders who covered this up from readers/viewers with gaslighting, half-truths, and outright deceptions.
In truth, the ‘utter bullshit’ came not from people concerned for Biden’s health, but from an establishment hell-bent on disguising Biden’s withering. Their gaslighting was ceaseless. When a New York Times poll in March found that 73 per cent of Americans agreed – ‘somewhat’ or ‘strongly’ – that Biden is ‘just too old to be an effective president’, journalism professor Jeff Jarvis raged: ‘This is not journalism.’ It is ‘shameful’, he said, to make age an ‘issue’. Timeslammed the ‘ageist attacks [on] President Biden’. ‘Biden’s big problem? Your ageism’, sneered one columnist at bigoted America. Just this month, White House press secretary Karine Jean-Pierre said video clips of Biden looking lost and confused are mostly ‘cheap fakes’ made by right-wingers in ‘bad faith’.
Here’s the truly sinister thing: many of these people who said Biden was fine knew he wasn’t. They knew the White House insisted he always be flanked by minders, lest he stumble physically or verbally, in what was known by insiders as ‘Operation Bubble Wrap’. They knew he had become so frail that even special counsel Robert Hur decreed he should not be charged for keeping classified documents because he is an ‘elderly man’ with ‘poor memory’ and ‘diminished faculties’. They knew he was receiving regular physical tests but not cognitive tests, for fear of what might show up. They knew but they denied and lied and snapped at any uppity member of the public who said ‘Is Biden okay?’.”
Spiked’s O’Neill, wrapped by saying this.
And why did they cover up Biden’s troubles? For power. In order that they might still rule. Out of naked, brutal self-interest. The Democratic elites and their footsoldiers in the cultural establishment are painfully aware they have few big-hitters who can connect with the public. Kamala Harris? Please. Gavin Newsom? Even Californians have tired of him. So out of desperation, they put blusher on Old Joe, fed him lines they prayed he would remember, and sent him out in a wretched bid to secure their own political clout and cultural hegemony. Behold the ruthlessness of the technocratic class. We now know there’s nothing they won’t do to fortify their authority. We can feel sorry for Biden, but for the rest of them we should feel only contempt.”
O’Neill has been quoted saying: “Columnist Brendan O’Neill says the ‘Left liberal establishment’ are the militant wing of political correctness.”
According to left-leaning Bing’s artificial intelligence (AI) powered Copilot is the following Q&A on O’Neill.
Is Brendan O’Neill with the U.K. based Spiked a leftist?
Brendan O’Neill, a British pundit and author, has an interesting political journey. Once a Trotskyist and a member of the Revolutionary Communist Party, he wrote for the party’s journal, Living Marxism. Over time, his views evolved, and he now identifies as a “Marxist libertarian”12. While he has contributed to various publications and held different positions, it’s essential to recognize that his political stance is multifaceted and not easily categorized into a single label. 😊
Sorry, Copilot, but when someone identifies as a “Marxist” anything sounds left-wing. So, here is one more from the political left ripping Democrats and Democratic leadership as being power hungry, out of touch with the common men and women they claim to represent. Recall that just days ago Democratic Congressman and former Democratic presidential hopeful Set Moulton (MA-D) admitted that Democrats are the party of the “ultra-wealthy” and “ultra poor.”
7) Another example of the ‘cover up’ of Joe Biden’s condition is the following from former left-leaning New York Times editorial (op-ed staff editor) department’s Bari Weiss.
Biden is no longer fit to be president. Last night’s debate exposed the lies we’ve been told.”
Rarely are so many lies dispelled in a single moment. Rarely are so many people exposed as liars and sycophants. Last night’s debate was a watershed on both counts.
The debate was not just a catastrophe for President Biden. And boy—oy—was it ever.
But it was more than that. It was a catastrophe for an entire class of experts, journalists, and pundits, who have, since 2020, insisted that Biden was sharp as a tack, on top of his game, basically doing handstands while peppering his staff with tough questions about care for migrant children and aid to Ukraine.
Anyone who committed the sin of using their own eyes on the 46th president was accused, variously, of being Trumpers; MAGA cult members who don’t want American democracy to survive; ageists; or just dummies easily duped by “disinformation,” “misinformation,” “fake news,” and, most recently, “cheapfakes.”
Cast your mind back to February, when Robert Hur, the special counsel appointed by the Department of Justice to look into Biden’s handling of classified documents, came out with his report that included details about Biden’s health, which explained why he would not prosecute the president.
“We have also considered that, at trial, Mr. Biden would likely present himself to a jury, as he did during our interview of him, as a sympathetic, well-meaning, elderly man with a poor memory,” Hur wrote. “It would be difficult to convince a jury that they should convict him—by then a former president well into his eighties—of a serious felony that requires a mental state of willfulness.”
Can anyone doubt that characterization after watching Biden’s debate performance? …”
8) In a Real Clear Politics report pre-debate (6.22.2024) “Former Gov. Andrew Cuomo (D-NY) on Friday’s episode of ‘Real Time’ told HBO host Bill Maher that former President Donald Trump would have never been on trial if his last name wasn’t Trump and if he was not running for president.” Here is a transcript of the relevant discussion.
BILL MAHER, HOST: The trial in New York, the one he got convicted for, was the greatest fundraising bonanza ever. He is now, he was lagging behind Biden and now he’s pulled quite a bit ahead. That trial was the greatest reason people had to send their checks for $5, 10, 25, whatever dollars, to Donald Trump.
So I was always with you on the one in New York, the hush money trial. I don’t think they should have brought that one. It was just always going to look like a sex case and people were always just going to look at it that way. So anyway.
FORMER GOV. ANDREW CUOMO (D-NY): That case, the Attorney General’s case in New York, frankly should have never been brought. And if his name was not Donald Trump, and if he wasn’t running for president from the former AG in New York, I’m telling you that case would have never been brought. And that’s what is offensive to people. And it should be. Because if there’s anything left, it’s belief in the justice system.
So, a Democrat – Cuomo, a leftist who at one point was thought of as a likely Democratic candidate for the presidency, and Maher, a leftist who makes the periodic effort for balance, took shots at the validity of the so-called “hush money trial” in a heavily Democratic district, by a judge who would not recuse himself even though Judge Juan Merchan’s was a known Biden donor. The right-leaning U.K. Daily Mail said:
[Judge] Juan Merchan’s daughter, Loren, 34, works for progressive digital strategies firm Authentic Campaigns
She [Loren Merchan] was a digital director for Vice President Kamala Harris’ 2020 presidential campaign and has worked for a slew of other Democratic campaigns
Trump mentioned during the debate that the conviction would likely be overturned on appeal. It should be, based on those insights alone. Every American is guaranteed a trail by an unbiased jury of their peers. The New York case was fraught with political corruption and had Democratic fingerprints all over it, as Cuomo (D) and Maher indicated.
What does this have to do with manufactured housing? Duh! The federal government has their hands all over our profession, and many others too. It is apparent that some information that isn’t convenient for the narrative of powerful is buried, denied, lied about, and the opposition is often smeared.
Look. No one has to believe that Trump is a saint. He’s not. Trump has his flaws, and his supporters know them. But much of the left-leaning media, and some ‘never Trumper’s’ on the center-right, have smeared the man as if he was Adolf Hitler, Joseph Stalin, and Chairman Mao all rolled into one. That was always nonsense. Trump wasn’t the war monger that he was accused of being before he took office or once again now. That “Two Minutes of Hate” Orwellian style tactic is designed to keep those independents and those who are on the left (or are otherwise ‘never Trump’) in the left.
Numbers of claims made by Biden in 2020 have since been proven to be clever lies or deceptions. For example. Biden and Hunter knew that laptop belonged to his drugged addled son. That letter Biden referenced from 51 intelligence agency connected professionals. In hindsight, it was a “psy-op” involving our nation’s spy agencies being deployed against Americans. The CIA – among others – has a history of such operations in foreign nations, but it is not supposed to be deployed against Americans. For over 100 years, several Democrats and some Republicans (e.g.: Presidents Bush senior and his son “W“) have deployed information operations against U.S. citizens to sway elections and/or lead the public into voting in ways that more honest statements would have likely meant no war for Americans would have followed. Some Democrats and certain Republicans have warned against such vexing problems. But obviously the public is more easily swayed when big media (now, big media and big tech) are allowed to work with public officials and/or political leaders to mislead and deceive the public.
10) In a sense, it doesn’t matter if Biden stays in the race or if someone else takes his place as the Democratic candidate for the White House. Either way, the party’s leadership obviously knew the truth and covered it up. It would be foolish to reward their deception with your votes. While Republicans have at times raised the issue, some in the GOP have been complicit. Now ousted Congressional reps Adam Kinzinger (IL-R) and Liz Cheney (WY-R) are among them.
11) The fact that numbers of Blacks, Hispanics, Women, and voters who often have been more traditionally Democratic are moving into the Trump camp should speak volumes. When the gaslighting and lies are so big, as now becoming clear for more Americans is the case of Joe Biden, it should follow if they lie about one thing, they will do so about others. Biden was known to be racially biased, described himself as a “prostitute” for the wealthy/elite years ago, and was proven in a prior presidential run to be an apparent plagiarist. The man has very low scruples. For whatever his flaws, and to Cuomo’s point cited above, Trump has been consistent on many of his views for decades, long before he ran for president. He wasn’t viciously attacked in the same way he is since he rode that golden escalator at Trump Tower with Melania Trump at his side in 2015 to announce his candidacy. This interview with Oprah Winfrey is one of many possible examples of the young Trump being fawned over, while the Trump of the past 9 years being the object of some 9 years of smears.
Here is a news clip of Biden dropping out of the 1988 race due to his purported lying and plagiarism.
The same things he was apparently guilty of in 1988 are part of Biden’s hallmarks as a politician today: boldly lying, cronyism, and a willingness to pander in utterly insincere ways. While some left-leaning journalists covered such matters pre-2020, obviously not enough did so in the level of detail that would have made Biden clearly who he is to left-leaning readers and viewers. As former Democrat, former award-winning journalist turned conservative pundit Chris Plante repeatedly says, the left-leaning media is complicit in covering for Biden and others like him.
Biden plays at being a faithful Catholic, even though Catholic Cardinal Raymond Burke recently condemned Biden for scandalously receiving Holy Communion despite repeated warnings that he should not do so due to his many public departures from Catholic teaching. The point is that on issue after issue, the man is a notorious sellout of America, Americans and is an apparent con. MHProNews didn’t have to do a ton of research to find and report examples of how leftist Biden was, even though the much of the left-leaning media painted Biden as a ‘moderate’ Democrat. Facts are whatever they are, and people ought to be willing to look at evidence, not myths or masks, before they vote.
12) There is no guarantee that Trump will unleash manufactured housing if he is elected. But what is certain is that his philosophy is more likely to be in line with doing so than what has been witnessed in 3.3 years of Joe Biden in the White House. The Biden-Harris regime has talked about manufactured housing in numerous documents, as MHI likes to tout. But when the facts are examined, what has Biden-Harris actually done for the HUD Code manufactured home industry? By contrast, a source at the Trump White House in 2020 told MHARR and MHProNews that they were seriously considering a push to implement the enhanced preemption provision of the Manufactured Housing Improvement Act of 2000.
13) There are no perfect women or men running to be president. There are no perfect candidates. This writer has numerous items, which have been covered in reports, that indicate what weakness of Trump or other candidates running in 2024 are. If someone is on the left and can’t find it in their minds or hearts to vote for Trump, despite the fact that Biden is an apparent scoundrel, there are third-party candidates like Robert F. Kennedy Jr (former Democrat, who said Biden is the bigger threat to Democracy), Cornell West, Jill Stein, and Chase Oliver. But to be clear, Democrats are working to keep those alternatives to Biden off the ballot in as many states as possible. Left-leaning media like the New York Times, Washington Post, NBC News, PBS and other sources have said that in 2024 Democrats are making record investments to counter third-party candidates. or any number of reasons to vote for Trump and his party’s supporters. As a headline from NBC proclaimed earlier this year:
Democrats prepare to go to war against third-party candidates
There are any number of reasons not to vote for Democrats who have been covering up the truth from the American public for years about Biden, he and his son’s purported scandals, and his failing policies. To learn more, see the linked or related reports. ###
Our son has grown quite a bit since this 12.2019 photo. All on Capitol Hill were welcoming and interested in our manufactured housing industry related concerns. But Congressman Al Green’s office was tremendous in their hospitality. Our son’s hand is on a package that included the Constitution of the United States, bottled water, and other goodies.
Tony earned a journalism scholarship and earned numerous awards in history and in manufactured housing.
For example, he earned the prestigious Lottinville Award in history from the University of Oklahoma, where he studied history and business management. He’s a managing member and co-founder of LifeStyle Factory Homes, LLC, the parent company to MHProNews, and MHLivingNews.com.
This article reflects the LLC’s and/or the writer’s position and may or may not reflect the views of sponsors or supporters.